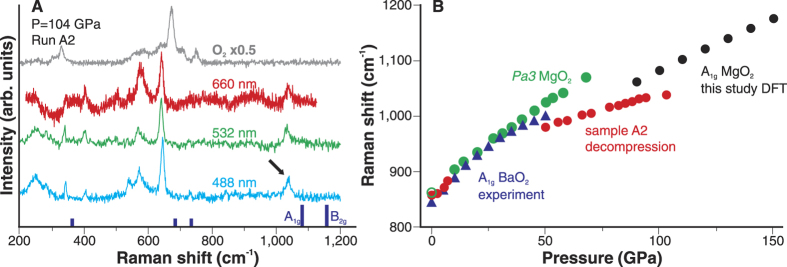
Figure 4.

(A) Raman spectra of MgO + O2 reaction products collected with 488, 532, and 660 nm excitations. Oxygen Raman spectra collected outside of the laser-heated region is shown for comparison. Dark blue vertical ticks correspond to the computed Raman modes of I4/mcm at 100 GPa (A1g and B2g modes may have observable intensities, according to our DFT computations). The 1037 cm−1 peak that can be assigned to the A1g mode in I4/mcm MgO2 is marked by an arrow. (B) Pressure dependencies of O-O symmetric stretching vibration (A1g). Red circles represent positions of the high-frequency mode observed in the A2 sample. Green circles correspond to the positions of the A1g band in Pa3 MgO2 measured in this study and in Ref. 19 (green open circle at 1 atm.). Blue triangles are positions of the A1g mode in BaO2. Black circles are computed frequencies of the A1g mode in I4/mcm MgO2.
