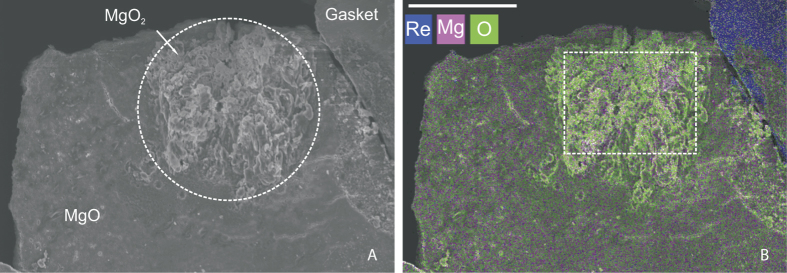
Figure 5. Electron microscope images of the extracted sample (run A2).

(A) SEM micrograph. Laser-heated area is shown with a dashed circle. (B) Energy-dispersive x-ray spectroscopy image. Color intensity is proportional to the element abundance. The laser-heated area (white dashed line) has higher oxygen content. The white scale bar corresponds to 15 μm.
