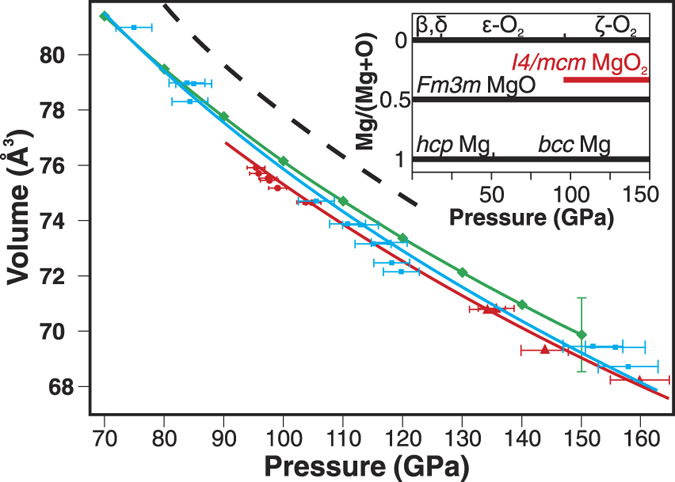
Figure 6. The 300 K third-order Birch-Murnaghan EOS of I4/mcm MgO2.

Red line is EOS fit to the experimental data from runs A1, A2 (red circles), and B2 (red triangles) collected upon compression. Blue line is EOS fit to the experimental data collected on decompression (B2* in the Supplementary Table S1). The pressure error bar is based on the reported uncertainty of the MgO EOS (A-runs) and the maximum pressure difference between MgO and Au pressure gauges (B-runs). Green diamonds and green line are the DFT EOS of I4/mcm phase. Black dashed line is the sum of the unit cell volumes of MgO and O2 (taken with proper coefficients as dictated by the synthesis reaction and the number of formula units in the MgO and O2 unit cells). Inset: Experimental pressure-composition phase diagram of the Mg-O system as determined in this work. Stable phases are shown with thick solid lines.
