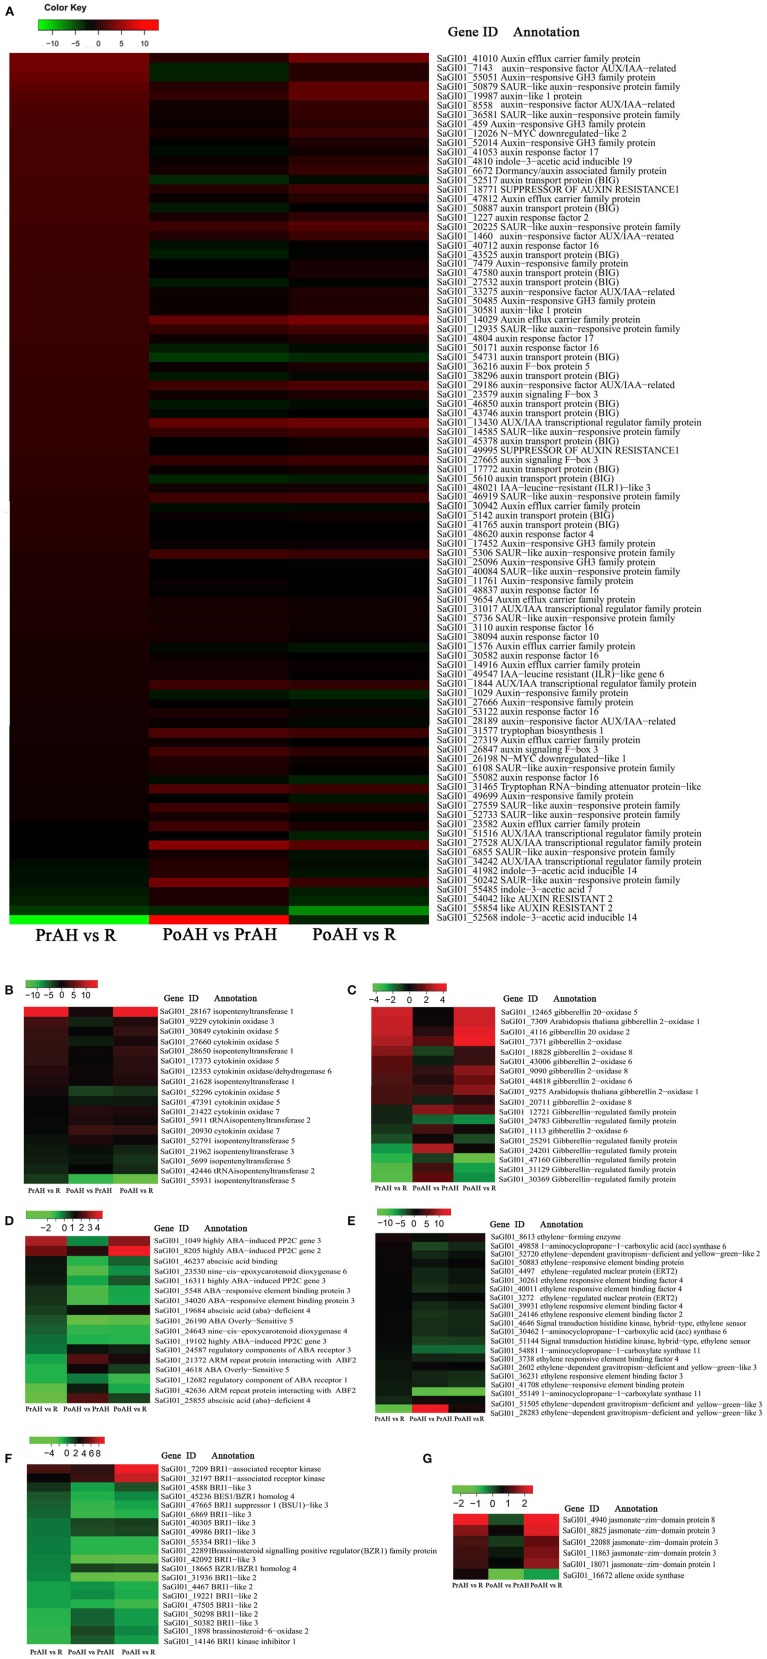
Figure 4.
Heat map diagrams of relative expression levels of DEGs annotated in biosynthesis, catabolism, and signal transduction pathways of auxin (A), CK (B), GA (C), ABA (D), ET (E), BR (F), and JA (G) among the three pairwise comparisons. The ratios are expressed as log2 FPKM (PrAH/R, PoAH/PrAH, and PoAH/R) values. Red and green colors indicate a relative increase or decrease in expression in the three pairwise comparisons.

