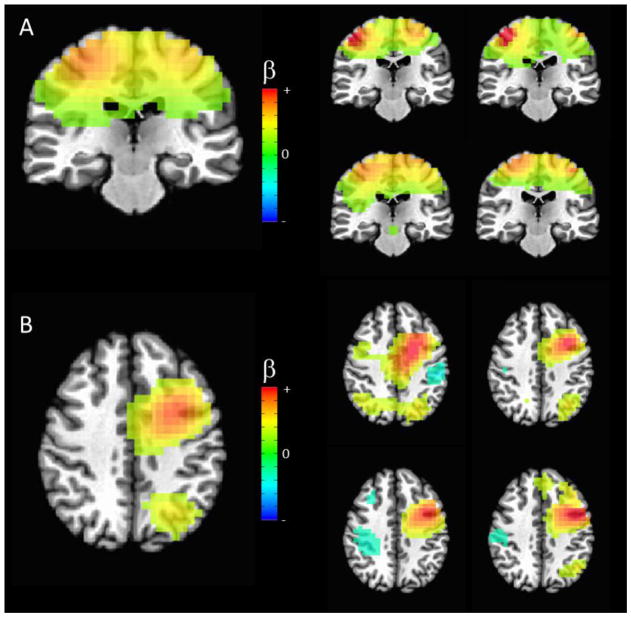
Figure 1.
Illustration of consistency among single participant independent component (IC) maps for two example networks: (A) Sensorimotor (Iq=0.72) and (B) Fronto-parietal, left lateralized (Iq=0.52). The group IC map is given on the left, while individual maps are shown for four arbitrarily chosen participants (the same four subjects are used to illustrate both networks). The sensorimotor network was highly robust across all participants. The fronto-parietal network was less robust in individual participants, although elements were visible in most datasets. All images are thresholded at a regression coefficient of 0.25.

