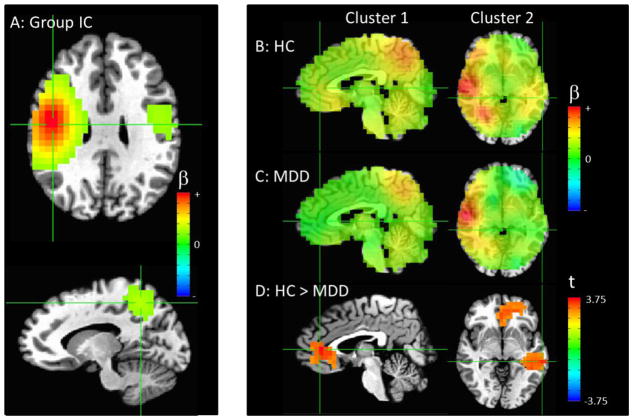
Figure 2.
(A) The combined group independent component (IC) with the primary node in the right precentral gyrus (crosshairs at peak in upper frame), with additional smaller nodes in left precentral gyrus and precuneus (crosshairs at peak in lower frame). (B) Image showing the IC map for all healthy controls and (C) patients, un-thresholded, with the crosshairs centered at the areas of significant differences between groups. (D) Areas of significantly decreased connectivity in MDD compared to control participants, thresholded at puncorrected <0.01, with only clusters significant at pcorr<0.05 shown. There is a cluster primarily in the subgenual cingulate cortex extending into the ventrolateral prefrontal cortex (pcorr<0.001, crosshairs centered on peak in left column), as well as a cluster in the hippocampus/parahippocampal gyrus (pcorr<0.001, crosshairs centered on peak in right column). Please note that the extrema of the color scales represent the approximate maximum value in the image.

