
Figure 3.
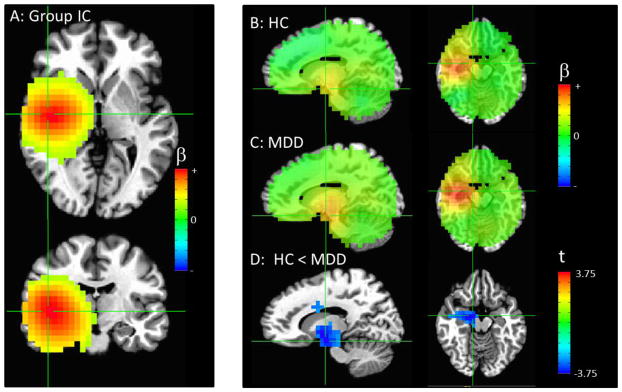
(A) The combined group independent component (IC) with the primary node in the right insula/temporal cortex (crosshairs at peak in both frames). (B) Image showing the IC map for all healthy controls and (C) patients, un-thresholded, with the crosshairs centered at the areas of significant difference between groups. (D) Areas of significantly increased connectivity in MDD compared to control participants, thresholded at puncorrected <0.01, with only clusters significant at pcorr<0.05 shown. Crosshairs are centered at the peak of the large cluster that encompassed the right amygdala, thalamus, and dorsal cingulate (pcorr<0.001, both left and right columns). Please note that the extrema of the color scales represent the approximate maximum value in the image.