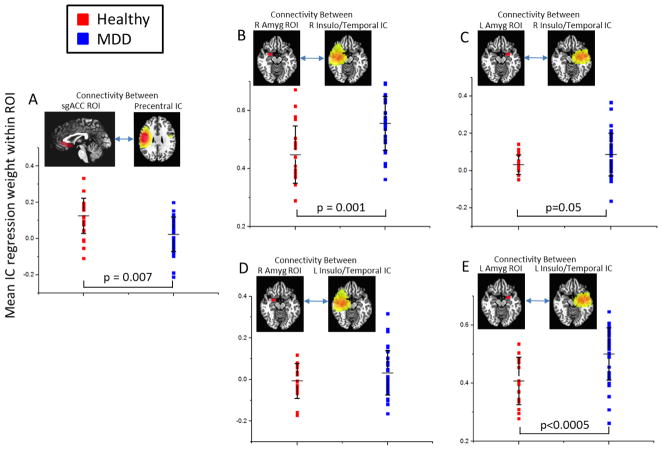
Figure 5.
Scatterplots showing connectivity between anatomically defined regions of interest (ROIs) and independent components (ICs) within regions known to be involved in the pathophysiology of MDD. (A) Connectivity between the precentral/precuneus IC and subgenual anterior cingulate (sgACC). (B) and (C) Connectivity between a right insulo-temporal IC and the right and left amygdala, respectively. (D) and (E) Connectivity between a left insulo-temporal IC and the right and left amygdala, respectively. All IC images are thresholded at β=0.25, with color scale maximum set to β=0.75.

