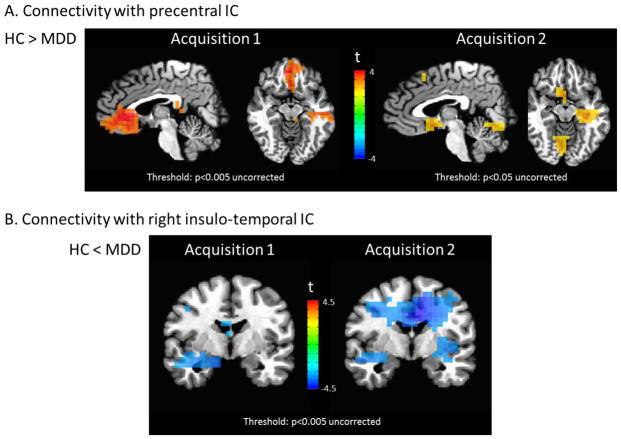
Figure 6.
Illustration of the concordance between voxel-wise group difference maps for Acquisition 1 (age/gender unbalanced sample overlapping with main study sample) and Acquisition 2 (fully independent recordings from similarly unbalanced sample). (A) Reduced connectivity to the precentral IC in MDD subjects was evident in both acquisitions. Two views (sagittal and axial) are shown to facilitate comparison of both the sgACC and hippocampus/parahippocampal gyrus clusters. Of particular note, compare the independent Acquisition 2 sample to the main finding in Figure 2D. (B) Image shows increased connectivity in the MDD subjects evident at identical statistical thresholds in both samples, analogous to the results in amygdala in Figure 3D. Please note that the extrema of the color scales represent the approximate maximum value in the image.

