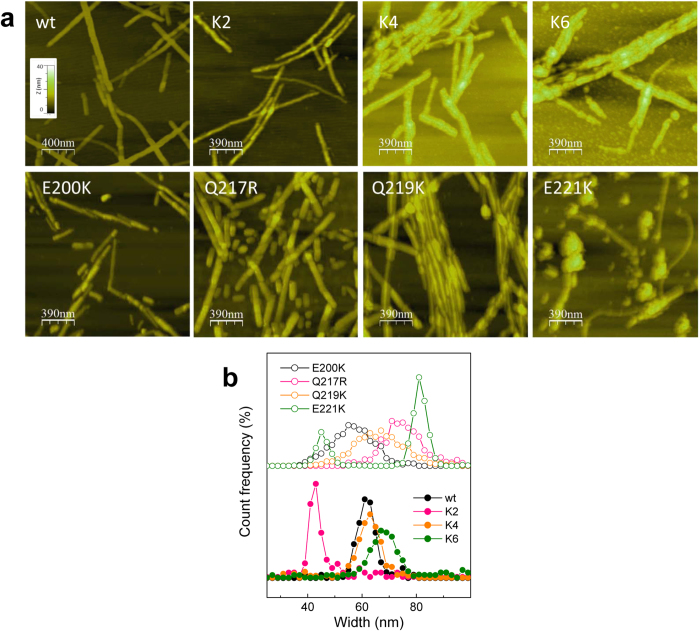
Figure 6. Topology images of the PrP wt and mutant fibrils.
(a) AFM images of the PrP wt and mutant fibrils corresponding to the topology mode. The z-axis was fixed for all graphs, and the color scale is displayed as an insert in the PrP wt panel. (b) Histogram of the width distribution of the distinct PrP assemblies.

