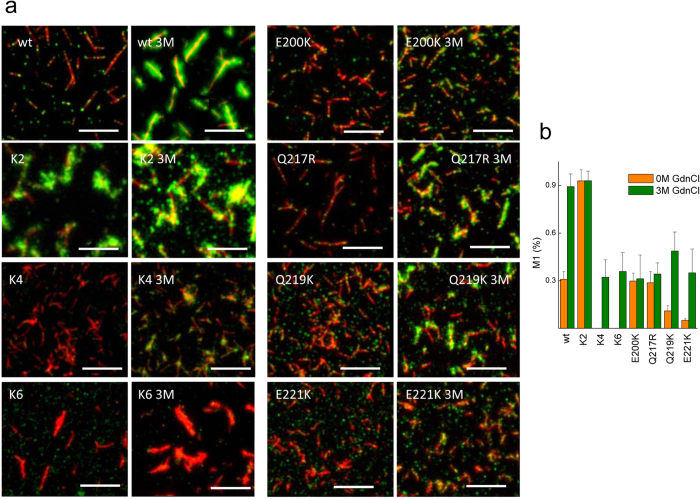
Figure 7. Surface reactivity of PrP wt and mutant fibrils.
(a) Representative fluorescence images of the fibrils formed by the PrP wt and mutant fibrils stained with AB3531 (red) and POM17 (green). Pretreatment with 3 M GdnCl is indicated as 3 M. The white bar represents 5 μm. (b) Effect of charges on the variation of the POM17 overlap with AB3531 (Manders overlap coefficient) based on the denaturant concentration. Error bar represents the standard deviation (s.d.).

