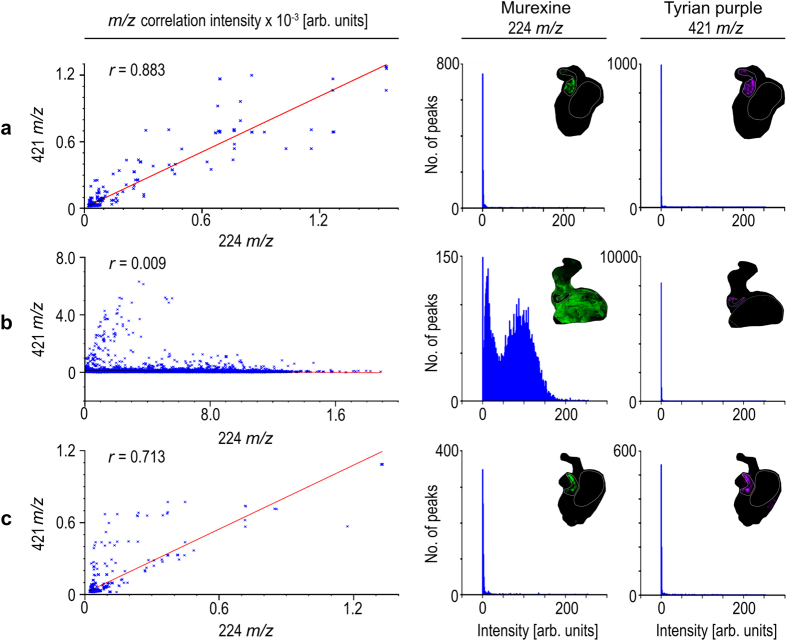
Figure 4. Representative correlation plots (left hand panels) for co-localised m/z patterns for murexine against Tyrian purple with corresponding intensity histograms of murexine (middle panels) and Tyrian purple (right hand panels) spot spectra generated in SCiLS Lab imaging software (Bremen, Germany).
Where Tyrian purple and murexine co-localise within; (a) pre-reproductive female tissue section; (b) reproductive female tissue section; and (c) post reproductive female tissue section, with intensities for murexine and Tyrian purple.

