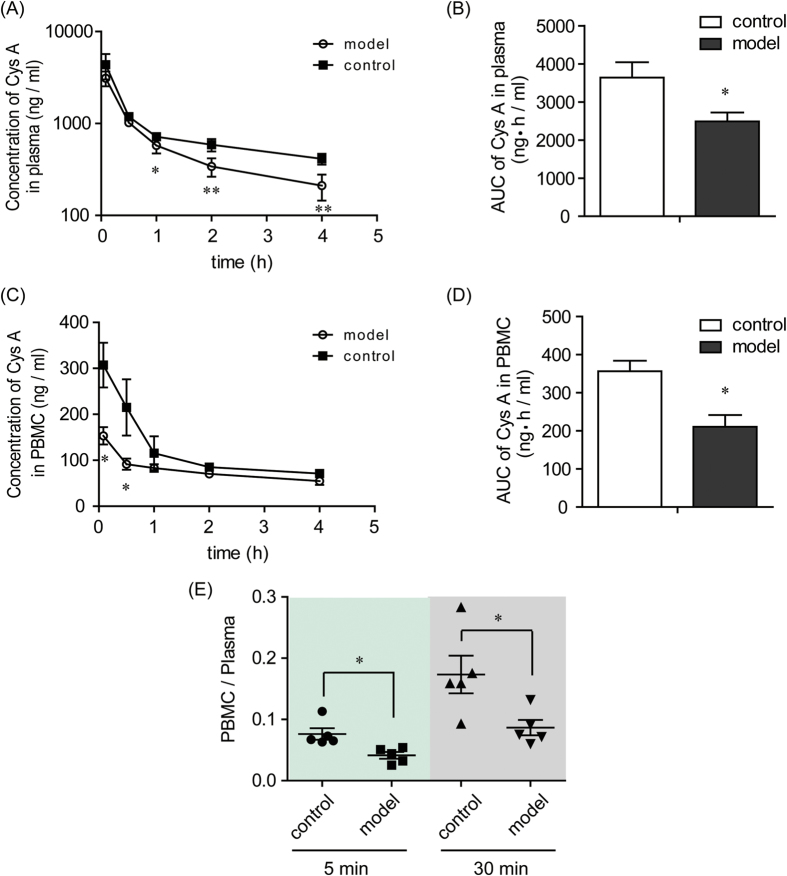
Figure 1. Plasma and cellular pharmacokinetic profiles of Cys A in control and TNBS-induced rats.
The control group was given a blank vehicle intrarectally, and the model group was administered a dose of 100 mg/kg TNBS intrarectally. On the 7th day, both groups were intravenously administered Cys A at a dosage of 10 mg/kg. Blood was collected at the designated time points post Cys A administration, and plasma and PBMC were separated. Concentrations of Cys A in plasma and PBMC were determined by LC-MS/MS, and concentration-time curves of Cys A in plasma (A) and PBMC (C) were plotted. The AUC of Cys A in plasma (B) and in PBMC (D) was calculated using the trapezoidal method. The ratio of Cys A concentration in PBMC to that in plasma at 5 min and 30 min post Cys A administration was also calculated (E). Data are expressed as the mean ± S.E.M.; n = 5/group. *p < 0.05, **p < 0.01 between the model group versus the corresponding control group.

