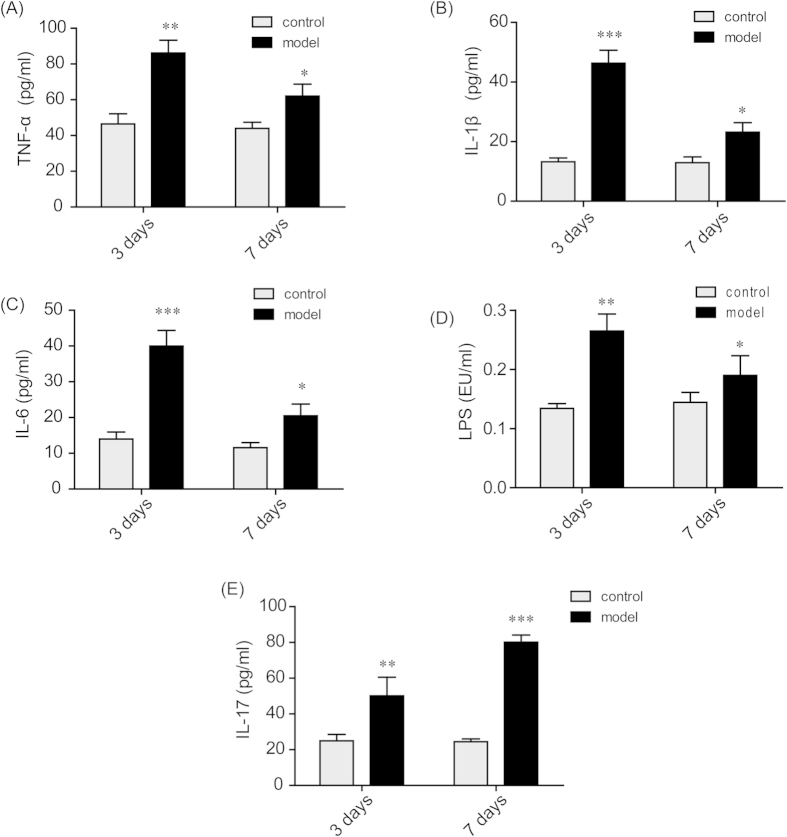
Figure 4. Increased cytokine and LPS levels in the plasma of TNBS-induced mice.
Plasma samples from the mice in the control group and the TNBS-treated model group were collected on the 3rd and 7th day after vehicle or TNBS administration. The concentrations of the cytokines TNF-α (A), IL-1β (B), IL-6 (C) and IL-17 (E) were determined by ELISA kits. The level of LPS (D) was analyzed by a Limulus Amebocyte Lysate assay. The data are presented as the mean ± S.E.M.; *p < 0.05, **p < 0.01, ***p < 0.001 between the model group versus the corresponding control group; n = 8/group.

