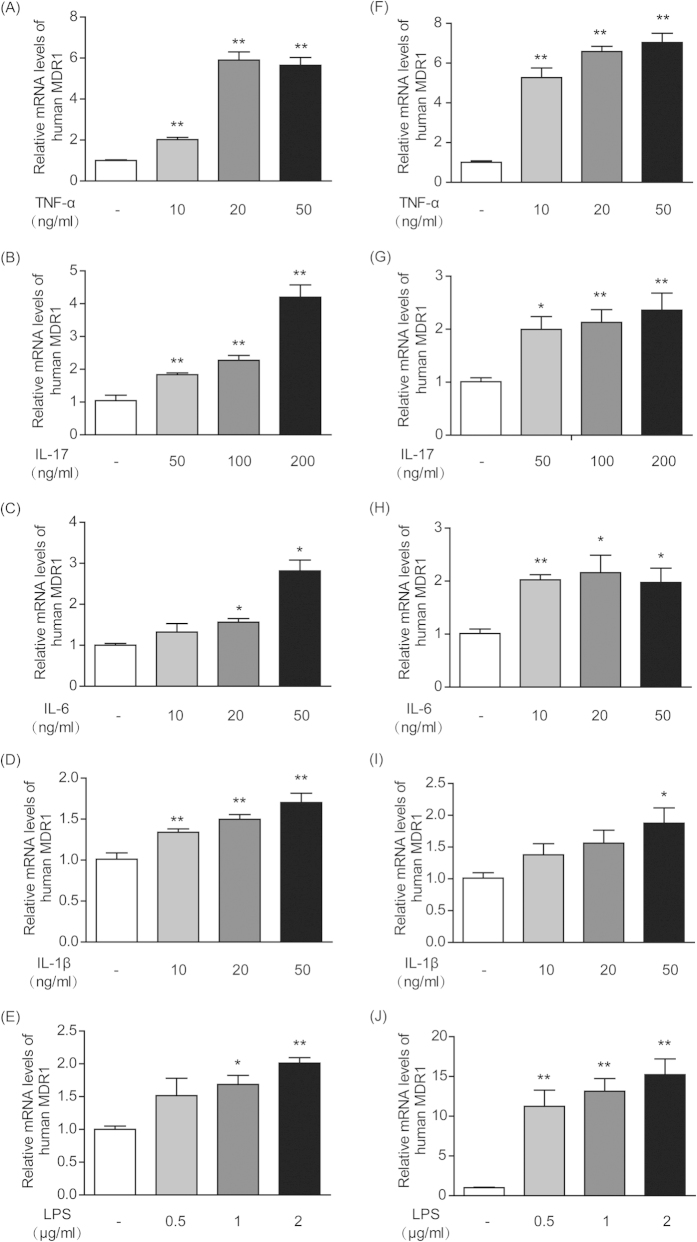
Figure 5. Cytokines and LPS increased MDR1 gene expression in human T-lymphocytes and monocytes in vitro.
CCRF-CEM cells were cultured with different concentrations of TNF-α (A), IL-17 (B), IL-6 (C), IL-1β (D) and LPS (E). THP-1 cells were also incubated with various concentrations of TNF-α (F), IL-17 (G), IL-6 (H), IL-1β (I) and LPS (J). The mRNA levels of MDR1 in the CCRF-CEM and THP-1 cells were measured by qPCR. Actin was used as an internal control. All of the data are shown as the mean ± S.E.M.; *p < 0.05, **p < 0.01 compared with the corresponding control group; n = 3.

