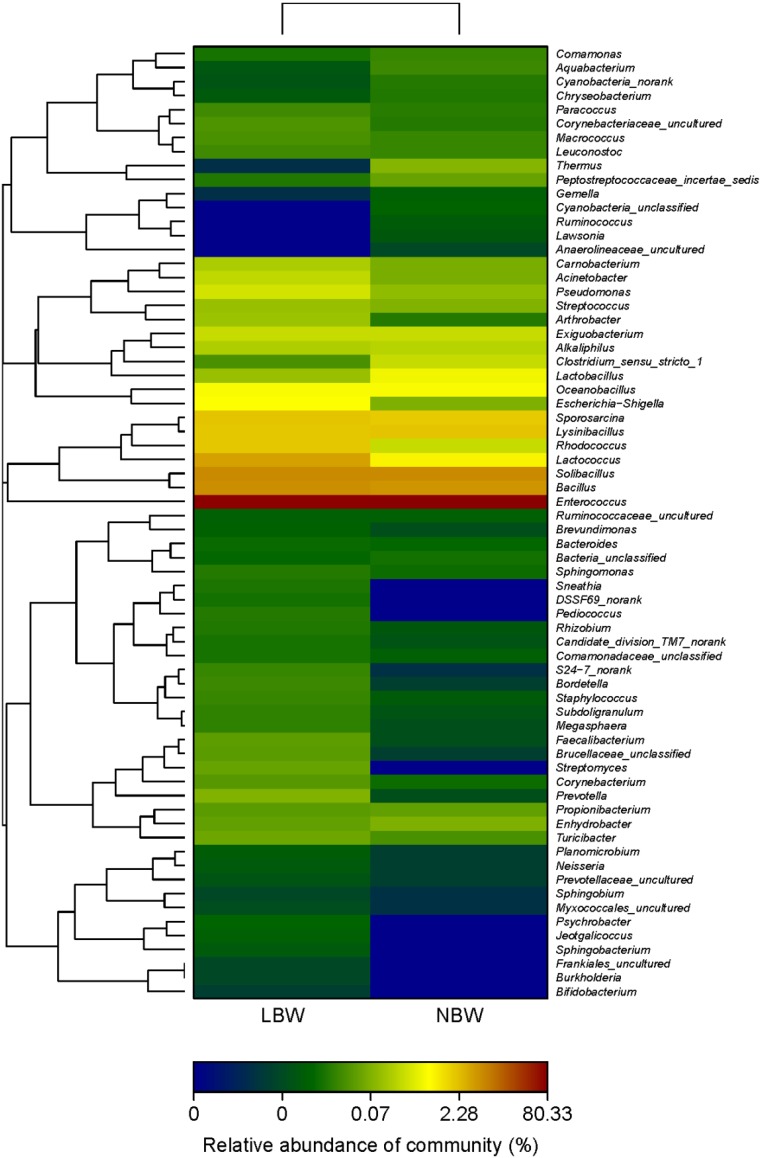
Figure 4.
Heatmap analyses of abundant genera in each group. n = 12, in each group. The y axis is a neighbor-joining phylogenetic tree, each row is a different phylotype. The abundance plot shows the proportion of 16S rRNA gene sequences in each group. Abbreviations: LBW, Low birth weight; NBW, Normal birth weight.

