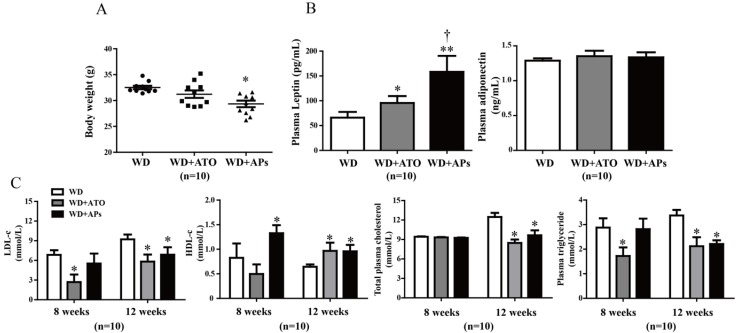
Figure 2.
The APs treatment normalized the up-regulated body weight and metabolic parameters in the WD-fed ApoE −/− mice. A: Assessment of body weight for the weeks 12; B: Concentrations of leptin and adiponectin in plasma; C: Total cholesterol, triglycerides, LDL-c, and HDL-c were quantified by enzymatic assays. The values are presented as the means ± S.E.M., n = 10 per group. * p < 0.05, ** p < 0.01, *** p < 0.001 vs. WD mice; † p < 0.05 vs. WD + ATO mice.

