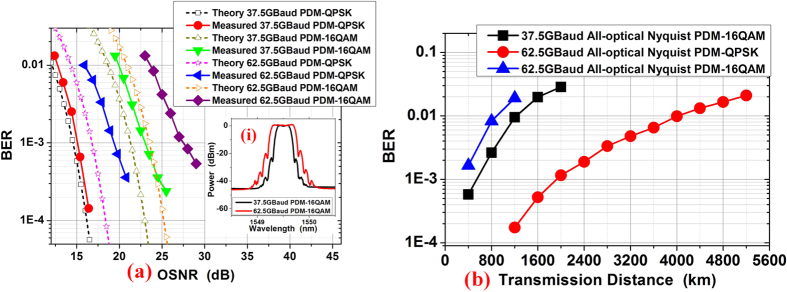
Figure 5. The BER results.

(a) The back-to-back BER versus the OSNR for different signals comparing with theoretical curves. Inset (i) shows the spectrum of 37.5 and 62.5 GBaud PDM-16QAM (0.02-nm resolution). (b) BER performance versus transmission distance for the PDM all-optical Nyquist signals.
