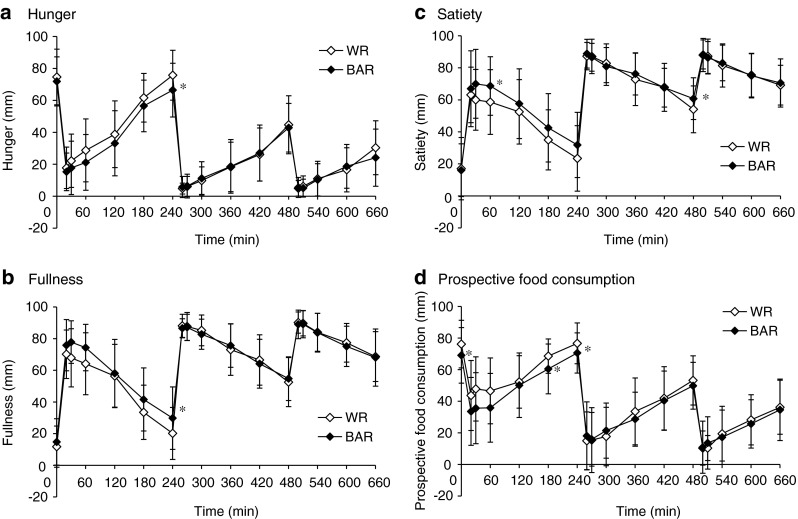
Fig. 3.

The visual analogue scale (VAS) scores of hunger, fullness, satiety, and prospective food consumption response after consumption of cooked white rice with β-glucan enriched barley (BAR) and white rice (WR). The line graph displays the time course of change throughout the testing day in the BAR (♦) and WR (◇) groups for VAS ratings of hunger, fullness, satiety and prospective food consumption at breakfast, lunch and dinner. Values are means (n = 21), with their standard deviation. Each of the VAS score time points were analyzed using paired t-tests (2-tailed). Statistical significance was defined at * P < 0.05
