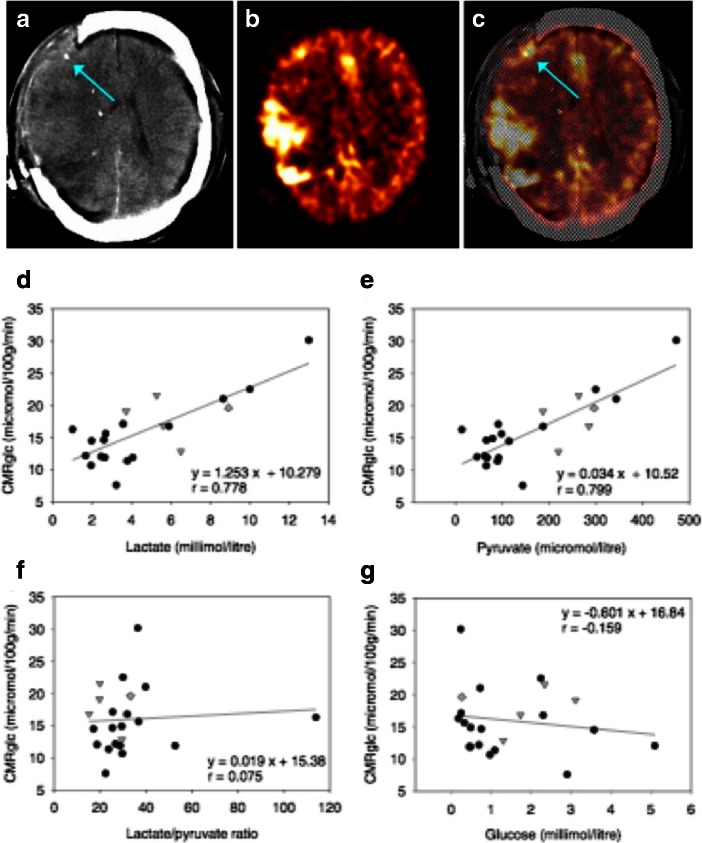
Fig. 4.
FDG-PET measurement of CMRglc and its relationship to brain microdialysate composition: a–c FDG-PET CMRglc map demonstrating relatively high FDG uptake at sites of injury, in contrast to less injured areas of the brain. a Computed tomography (CT) scan showing gold tip of microdialysis catheter (indicated by arrow). b Co-registered FDG-PET CMRglc map showing high FDG uptake at sites of injury. c Overlay of CT and co-registered CMRglc map, showing microdialysis catheter tip location (arrow). (d–f Graphs illustrating relationships by linear regression (for 22 ROIs in 17 TBI patients) between FDG-PET derived CMRglc and the microdialysis parameters measured during the scan (d) lactate, (e) pyruvate, (f) lactate/pyruvate (L/P) ratio, and (g) glucose. For the linear regressions in (d–g), corresponding values of p (ANOVA) are <0.0001, <0.0001, 0.74 and 0.48 respectively. Data-points from catheters at craniotomy sites (4 patients) are differentiated by grey triangles. Data-points from a second FDG-PET scan (one patient) are differentiated by grey diamonds. All other data-points are depicted as black circles (catheters inserted via cranial access device). Linear regressions presented on the graphs are for the entire (combined black plus grey symbols) dataset consisting of all 22 ROIs. Figure originally published in Acta Neurochirurgica (Hutchinson et al. 2009)

