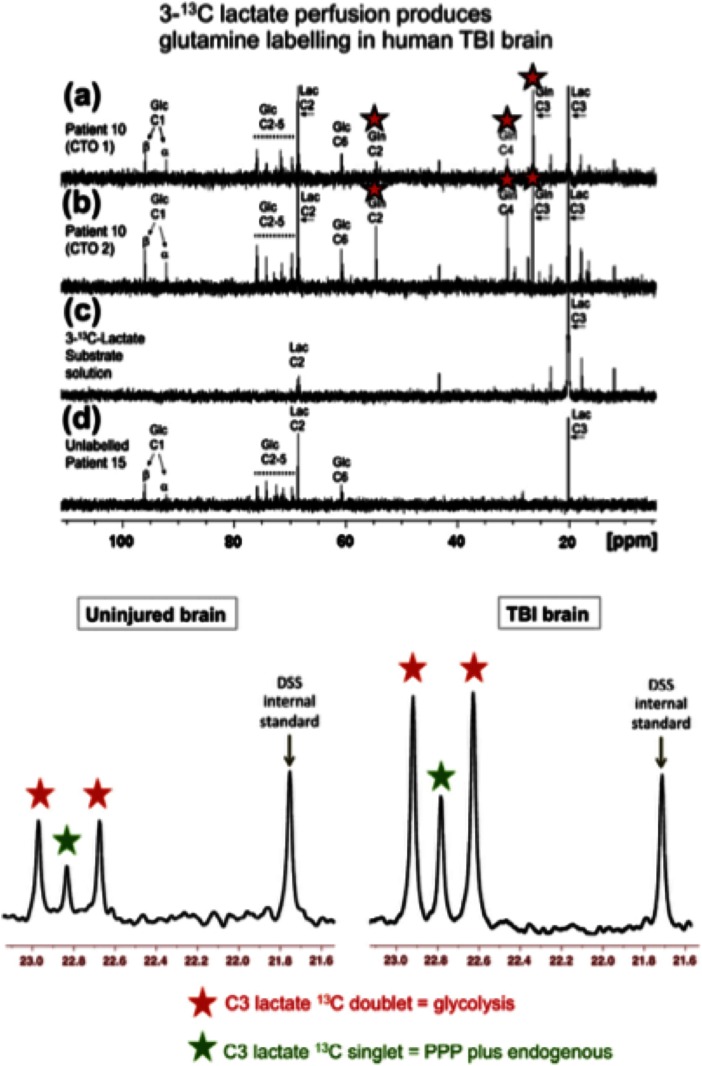
Fig. 6.
Illustrative 13C-NMR spectra achieved by ex vivo NMR of microdialysate after delivery of 3-13C lactate and 1,2-13C2 glucose to TBI patients: Upper panel: a and b Examples of 13C NMR spectra of brain microdialysates from a TBI patient, who received perfusion with 3-13C lactate (4 mM) by microdialysis catheters via a craniotomy (CTO); red stars indicate 13C signals for glutamine C4, C3 and C2 indicating metabolism via TCA cycle. c 13C NMR spectrum of the 3-13C lactate substrate solution prior to perfusing. d 13C NMR spectrum of brain microdialysate from an unlabelled patient. For further details, see Gallagher et al. (2009). Figure originally published in Brain (Gallagher et al. 2009). Lower panel: Examples of 13C NMR spectra of brain microdialysates from patients who received 1,2-13C2 glucose (4 mM) perfused via the microdialysis catheter. Uninjured brain is normal-appearing brain in a patient operated on for a benign tumour elsewhere in the brain. TBI brain is from a patient with a diffuse injury. The part of the spectrum illustrated in each case is for the C3 carbon of lactate. Also present in this part of the spectrum is one of the signals due to the internal standard DSS (2,2-dimethyl-2-silapentane-5-sulfonate sodium salt). The remainder of the spectrum (including the main DSS signal at 0 ppm) is not shown. The C3 doublet indicated by red stars represents lactate doubly labelled with 13C, produced by glycolysis; the C3 signal for 13C is split into 2 peaks by coupling to 13C also present at the neighbouring C2 position within the same molecule. The C3 singlet indicated by green stars represents lactate singly labelled with 13C, produced via the PPP. Figure originally published in European Journal of Pharmaceutical Sciences (Carpenter et al. 2014)

