Figure 2.
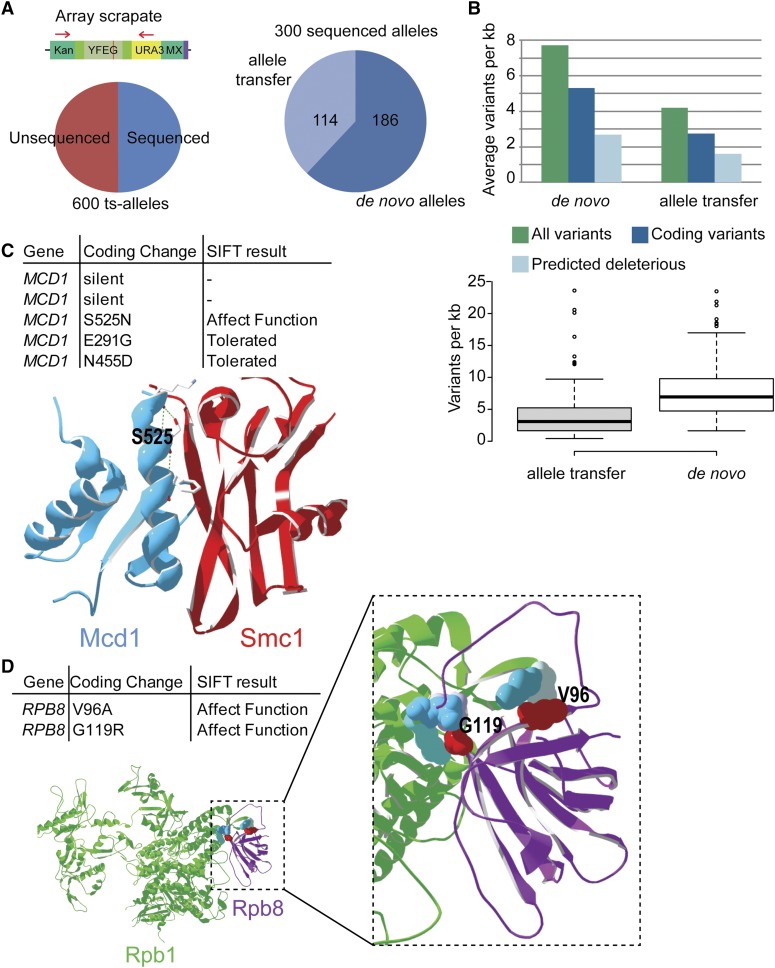
High-throughput ts allele sequencing. (A) Sequencing strategy and overall results. Genomic DNA from the array scrapate was subjected to PCR with flanking primers common to each allele (red arrows), followed by Illumina sequencing. High-quality sequence for 300 of 600 alleles was obtained in this manner, including 186 de novo constructed alleles and 114 alleles from Li et al. (2011). (B) Variant density in each allele population. Upper panel: Average variants per kilobase. Lower panel: Distribution of variant densities across alleles shown in box plots. For box plots, center line shows the median, box limits are the 25th and 75th percentiles, whiskers extend 1.5× the interquartile range, and dots represent outliers. (C and D) Examples of variant functional reports from Table S3 with corresponding structural investigation. (C) A single mutation predicted to affect function in Mcd1 (Blue) lays at the interfacial α-helix contacting Smc1 (red) (Haering et al. 2004). (D) Two mutations predicted to affect function in the RNA polymerase II subunit. Rpb8 (purple) lays its interface with Rpb1 (green).

