Figure 3.
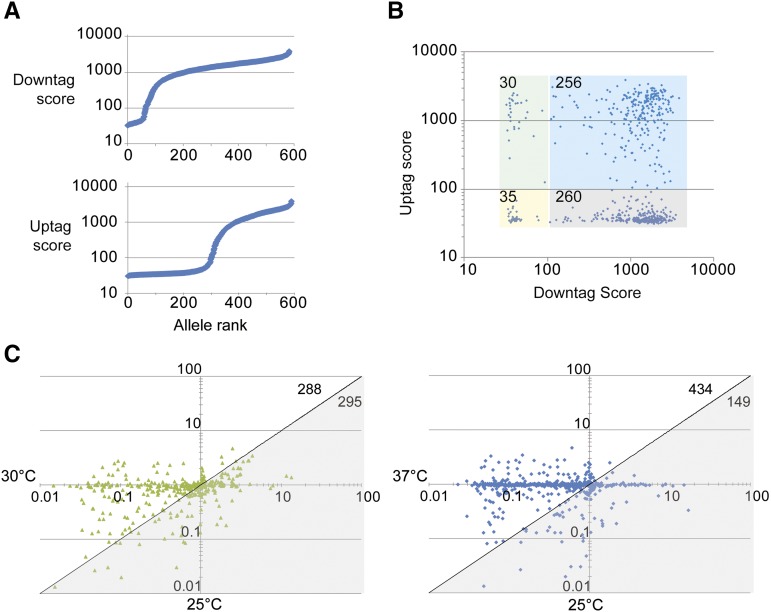
Detection of flanking barcodes in ts alleles by microarray. (A) The raw score of the barcodes detected in a pooled scrapate sorted by intensity for the 3′ downtag (top) and the 5′ uptag (bottom). (B) Comparison of downtag and uptag scores for each allele. 581 alleles had both barcodes represented on the microarray. For our purposes an arbitrary score cut-off of 100 was applied to group the data. Colored boxes indicate the groups chosen and the number of alleles in each group is shown in the upper left. Although most alleles retain a functional downtag, less than half have a functional uptag. (C) Competitive growth analysis of the ts allele collection outgrown at the indicated temperature. The microarray intensity score of each allele under control or experimental conditions is expressed as a ratio. The gray triangle highlights scores lower at 25°, whereas the white area shows higher scores. The numbers of alleles in each group are noted on the upper right. Note the shift of alleles into the white area at 37°. The average of three replicates is used in (C) and all axes are logarithmic scales.

