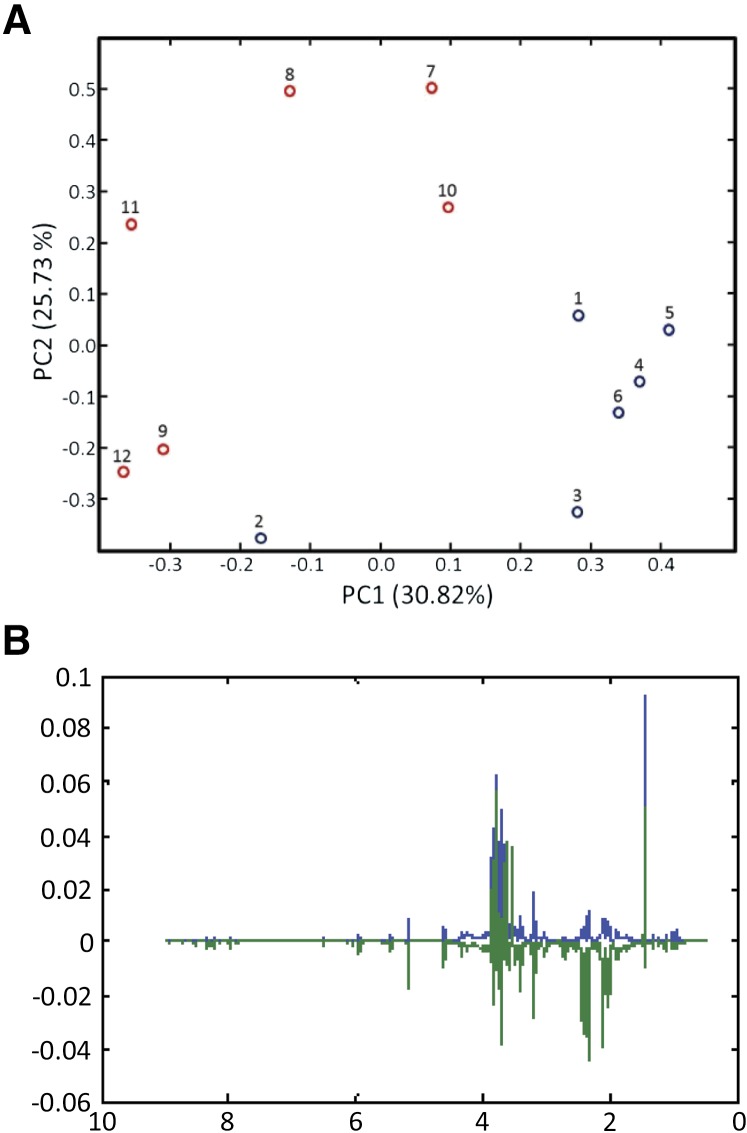
Figure 5.
PCA results for the 1H NMR spectra of strain pnit-6_1.5 cultured on Gln (samples 1–6; blue) and nitrate (samples 7–12; red). (A) PCA scores. Although the samples within a treatment are not tightly clustered, clear segregation of the samples by treatments is observed in the scores plot. (B) PCA loadings. The loadings plot highlights the 1H NMR resonances that make the greatest contributions to sample variance in this data set. The loadings for PC1 are shown in blue, and those for PC2 are shown in green.

