Figure 2.
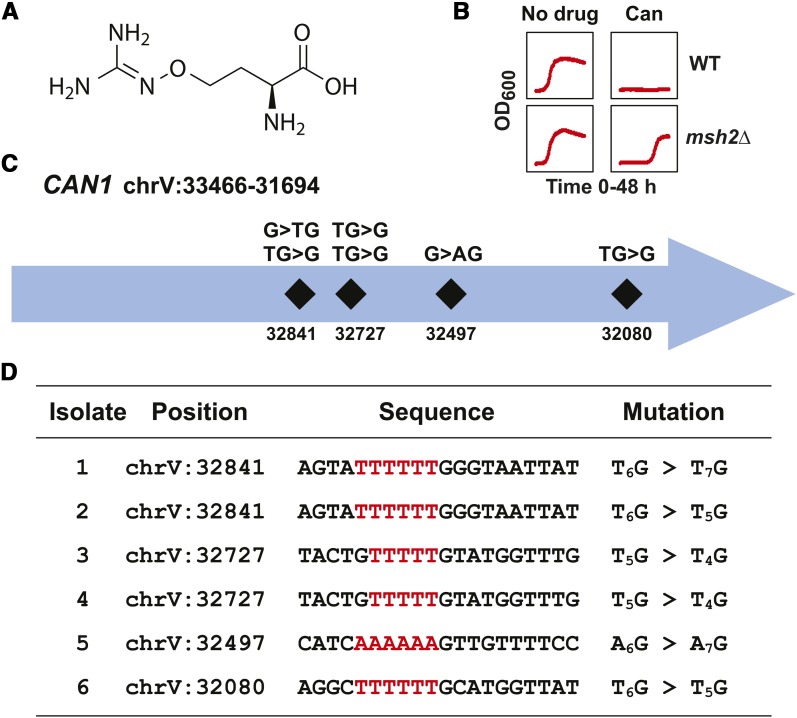
Verification of the resistance discovery method using canavanine. (A) The chemical structure of canavanine. The structure was rendered using ChemDraw. (B) Growth curves of erg6∆ pdr5∆ wild-type (WT) and msh2Δ erg6∆ pdr5∆ (msh2Δ) strains in the absence (No Drug) and presence of 200 μM canavanine (Can). Optical density readings at 600 nm (OD600) were taken every 15 min for 48 hr. (C) Schematic representation of the frameshift positions within the CAN1 locus on chromosome V (chrV) conferring resistance to canavanine. The numbers indicate the chromosomal position. The mutations all resulted in frameshifts at homopolymers detailed in the bottom panel. (D) A table listing the mutations in CAN1 conferring resistance to canavanine. The nucleotide position for each mutation is shown along with the region mutated. Because CAN1 is in the opposite orientation (chrV:33466-31694) within the W303 reference genome, the sequence shown is the reverse complement of the reference genome for the given interval. The insertion or deletion at the homopolymeric run (highlighted in red) is indicated for each isolate, for example, a deletion at an A6 repeat followed by a C (AAAAAAC) would be designated A6C > A5C, whereas an insertion would be CA6 > CA7.

