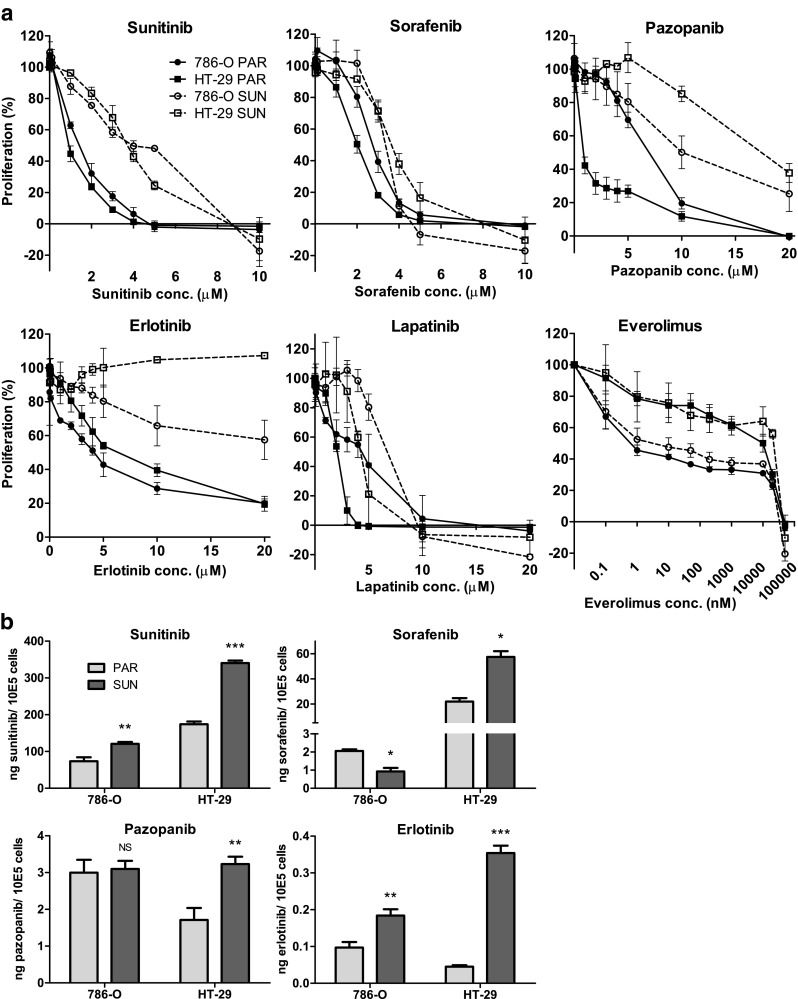
Fig. 2.

Cross-resistance of sunitinib-resistant cells. (a) cross-resistance patterns, determined by MTT proliferation assays, of the sunitinib-resistant 786-O SUN and HT-29 SUN cell lines to sorafenib, pazopanib, erlotinib, lapatinib or everolimus compared to parental (PAR) cell lines. (b) intracellular accumulation of sorafenib, pazopanib or erlotinib in parental (PAR) and sunitinib-resistant (SUN) cells. Cells were incubated for 24 h with drug-containing medium at the ~ IC50 concentration of the parental cell line (except sunitinib itself). Drug concentrations: sunitinib: 5 μM (786-O) or 10 μM (HT-29); sorafenib: 2 μM (both cell lines); pazopanib: 4 μM (786-O) or 2 μM (HT-29); erlotinib: 5 μM (both cell lines). Results are shown as mean ± SEM (n = 2–3). *, p value < 0.05; **, p value < 0.01; ***, p value < 0.001
