
Fig. 3.
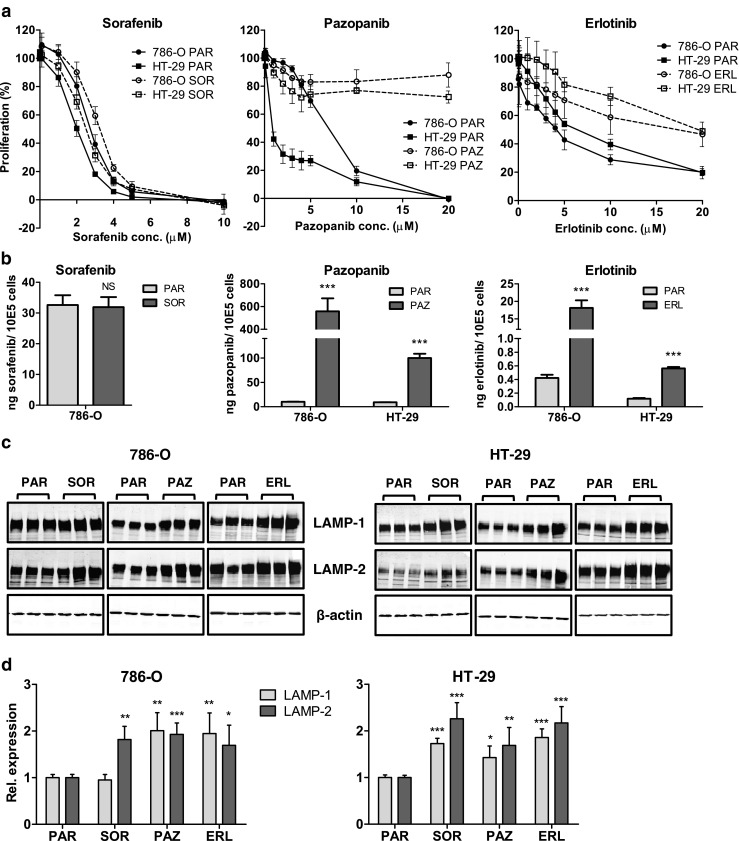
Induction of resistance to sorafenib, pazopanib and erlotinib. (a) resistance patterns, determined by MTT proliferation assays, of the 786-O and HT-29 cells continuously exposed to sorafenib (SOR), pazopanib (PAZ) or erlotinib (ERL) for 3–4 months. (b) intracellular accumulation of sorafenib, pazopanib or erlotinib in parental (PAR) and continuously exposed SOR, PAZ and ERL cells. PAR cells were incubated for 24 h with drug-containing medium at the concentration of the continuous exposure. Drug concentrations: sorafenib: 3 μM; pazopanib: 20 μM; erlotinib: 20 μM. (c) Western blot analysis of lysosome-associated membrane protein-1 and −2 (LAMP-1 and −2), as a measure of the lysosomal compartment. (d) quantification of LAMP-1 and −2 by Western blot analysis. LAMP-1 and LAMP-2 expression was corrected for β-actin expression, and normalized to untreated samples (PAR). P values are derived from comparison to the PAR cell line. Results are shown as mean ± SEM. *, p value < 0.05; **, p value < 0.01; ***, p value < 0.001