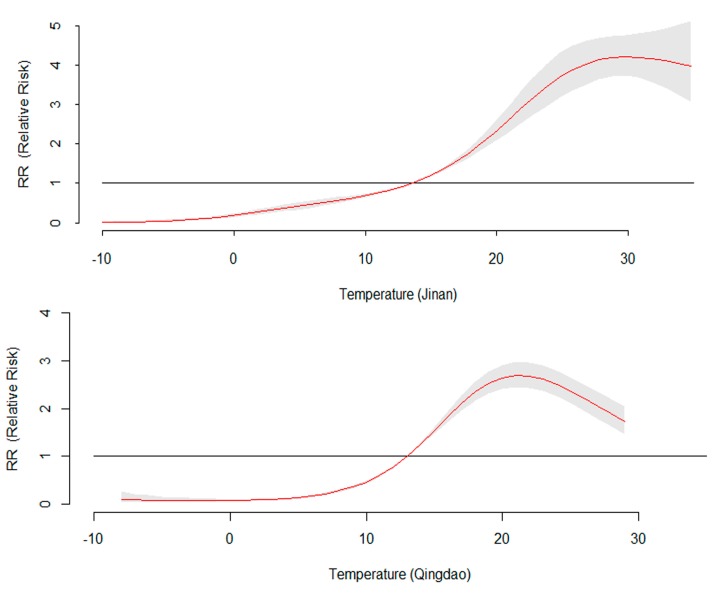
Figure 6.
Effect of daily mean temperature on daily HFMD incidence over lags from 0 to 14 days in the study cities, controlling for relative humidity, rainfall, sunshine duration, DOW, holidays, seasonal trend, and long trend. The maximum likelihood estimate of RRs is shown as smooth red lines and the pointwise 95% confidence intervals are shown in the gray regions.

