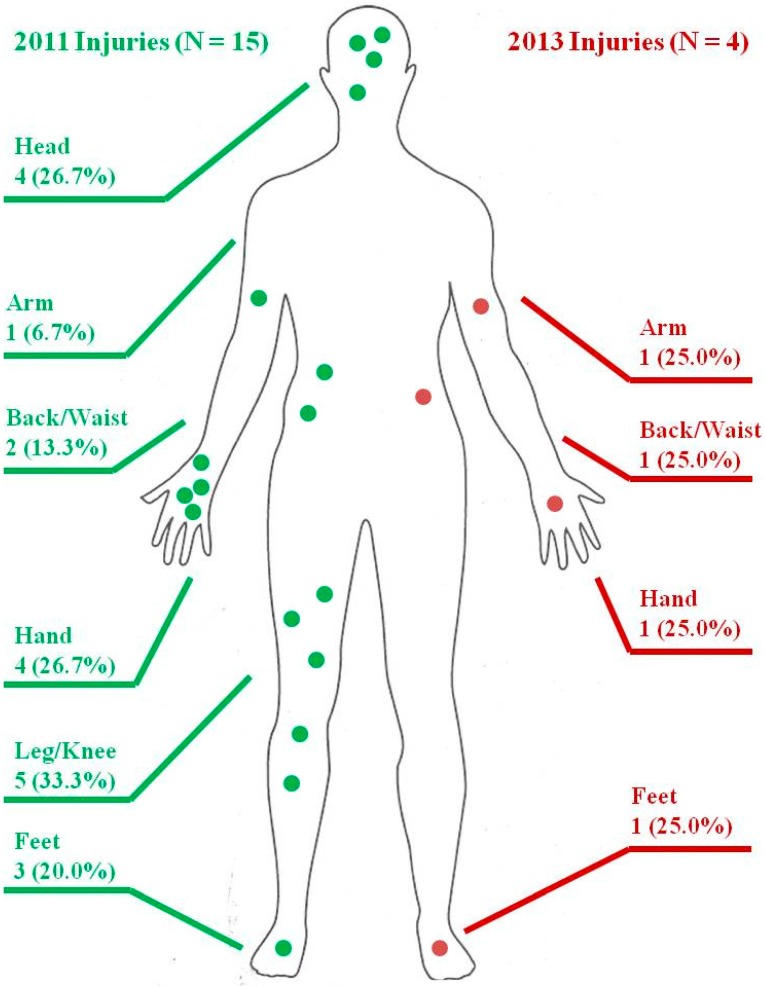
Figure 1.
Body injury locations and frequencies for worst injuries in 2011* and 2013**. * Reported injured body part(s) from mining-related injuries in the past year among 86 ever-miners in2011. The information is based on an open-ended question adapted into a similar question in 2013 for comparison. Only 15 out of 35 injured participants provided information about injured body parts. ** Reported injured body part(s) from the worst injury in the past year among 17 ever-miners in 2013. 4 out of 5 injured participants provided information about injured body parts.

