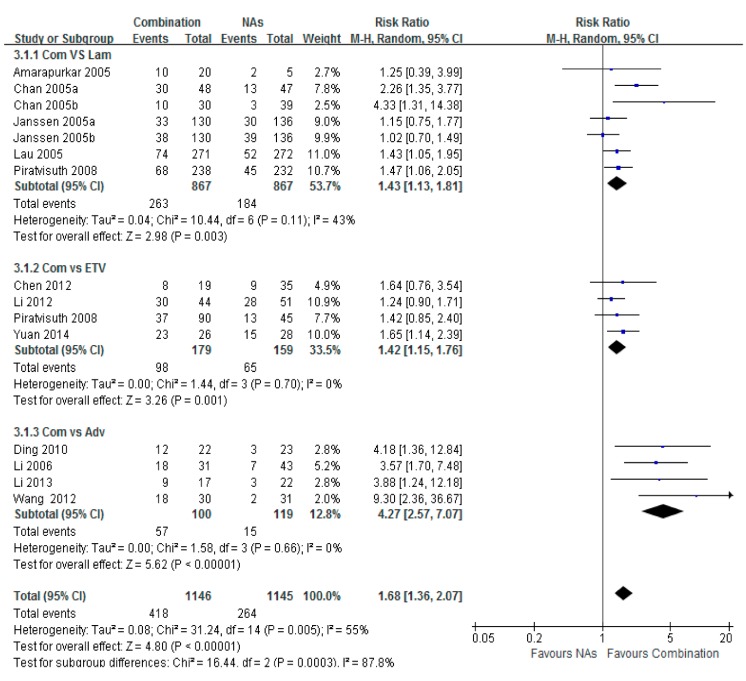
Figure 4.
Forest plot of the serum HBeAg seroconversion of combination therapy group vs. Lam, ETV and Adv group. Significant difference were observed in combination group between those groups. The highest group was combination vs. Adv group, and risk ratio was 4.27 (95% CI = 2.57–7.07, p < 0.001). The higher risk ratio of combination vs. Lam group was 1.43 (95% CI = 1.13–1.81, p = 0.002). The total risk ratio was 1.68 (95% CI = 1.36–2.07, p < 0.001).

