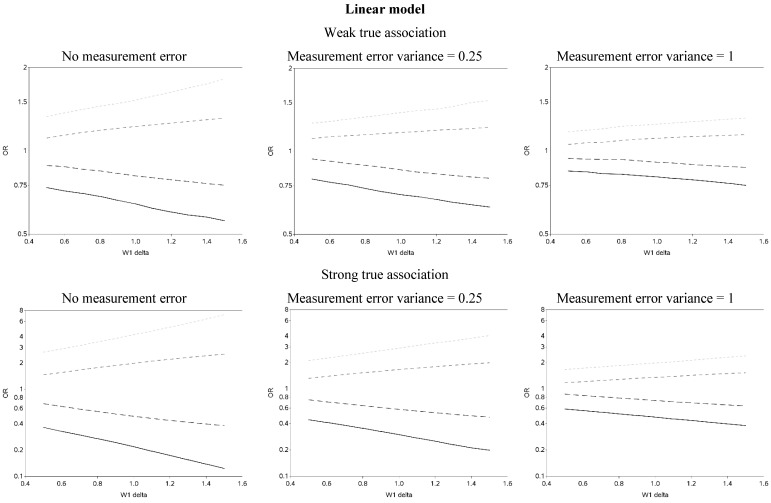
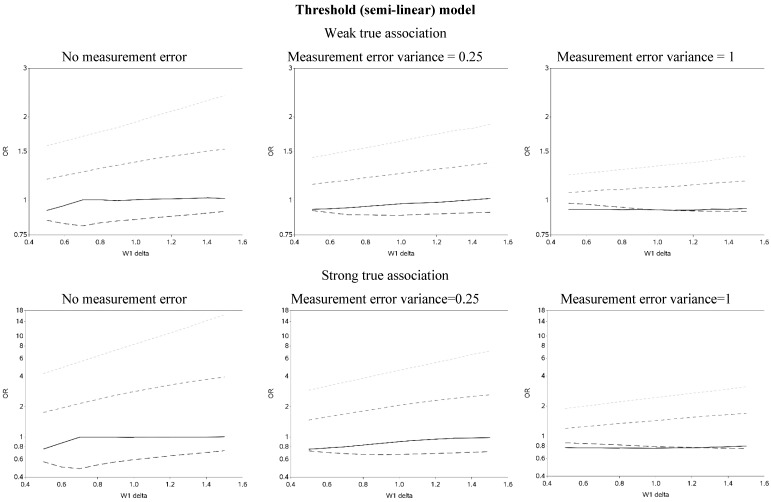
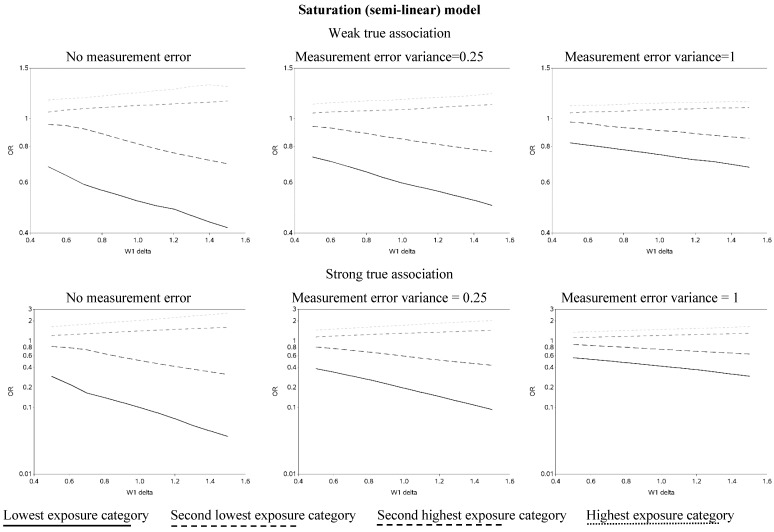
Figure 3.
Odds ratios (OR) for different cutoffs used to create 5 categories for the causal yet mismeasured exposure (W1) (δ is identified as “W1 delta” in the figure). The 4 W1 cutoffs were centered at 0 with δ from 0.5 to 1.5 standard deviations, in increments of 0.1. Reference category for W1 is mean +/− (0.5 × δ × standard deviation).


