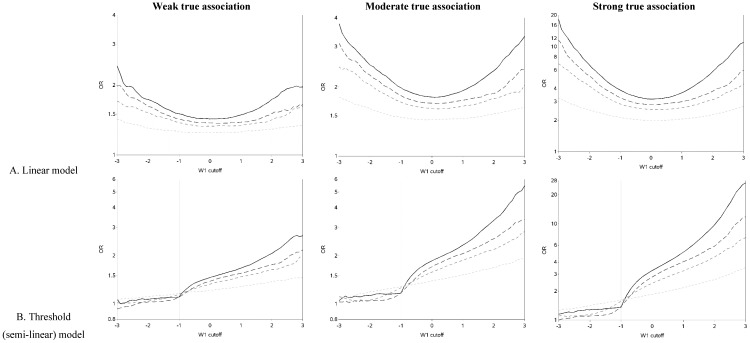
Figure A1.
Odds ratios for different cutoffs (between mean ±3 standard deviations) used to dichotomize a mismeasured exposure (W1) (all scenarios for Figure 2). The X1 cutoff was changed from −3.0 to 3.0 in increments of 0.1. Exposed W1 ≥ cutoff, referent: W1 < cutoff. The vertical reference line for the semi-linear models is the inputted inflection point.


