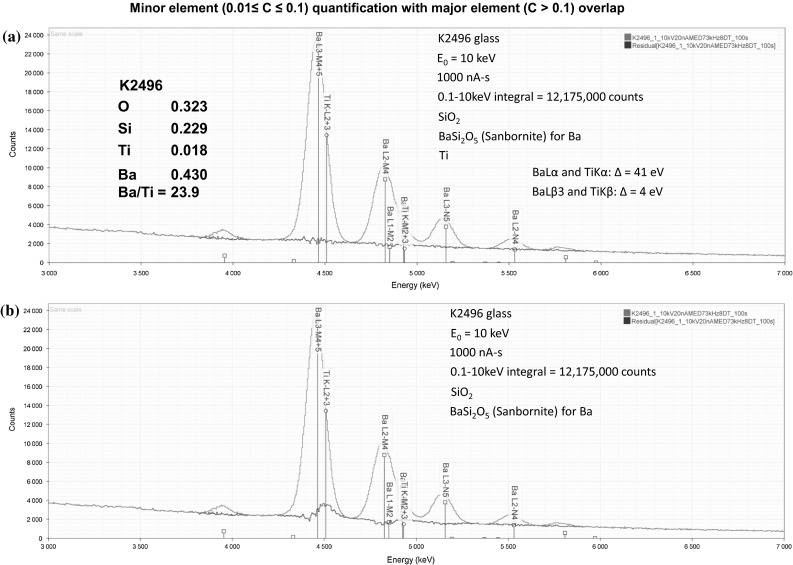
Fig. 17.

a SDD-EDS spectrum of NIST microanalysis glass K2496 showing the Ba–Ti region of the spectrum around 4.5 keV (red), and the residual spectrum after fitting for Si, Ba, and Ti (blue). Beam energy 10 keV; dose 1000 nAs; spectrum integral 0.1–10 keV = 12.175 million counts; b The same measured spectrum but with fitting only for Si and Ba (red), revealing the low-level TiKα and TiKβ peaks in the residual spectrum (blue) (Color figure online)
