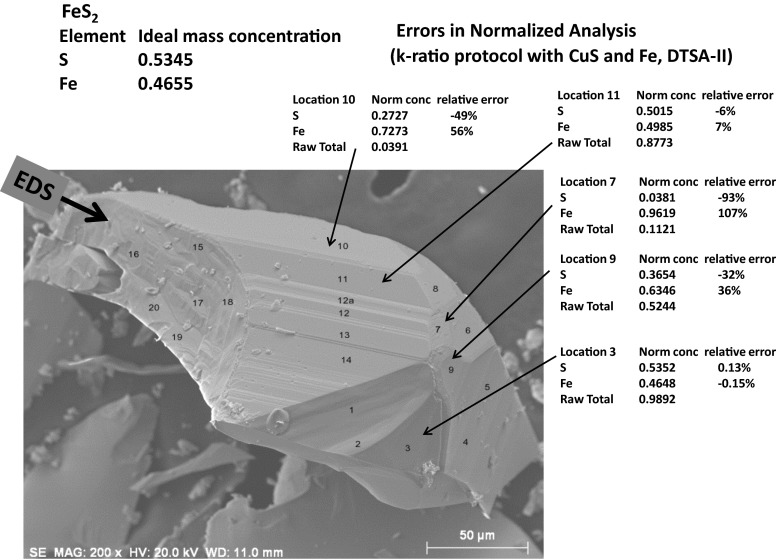
Fig. 21.
Analysis of S and Fe at several locations on a fragment of pyrite, FeS2. The normalized mass concentrations, relative errors, and the raw unnormalized analytical total obtained following k-ratio protocol analyses with NIST DTSA-II (Fe and CuS standards) are indicated at selected locations (Everhart–Thornley detector SEM image)

