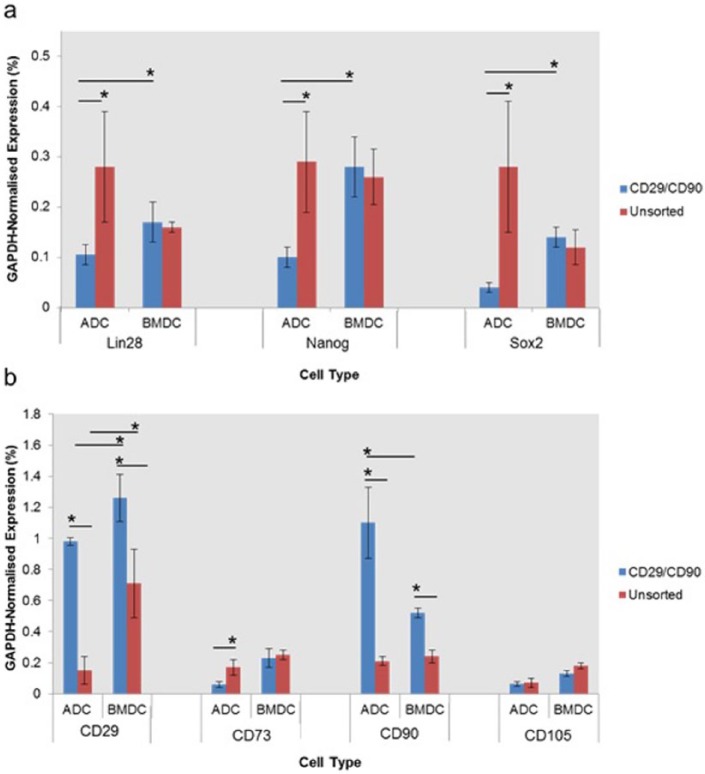
Figure 4.
Gene expression analysis comparing levels of transcripts associated with stem cell: (a) pluripotency and (b) multipotency for CD29+/CD90+ ADCs and BMDCs isolated using FACS, with unsorted controls. All analyses were performed on passage 1 cells that had reached ~80% confluence.
*p < 0.05, n = 3.

