Figure 1.

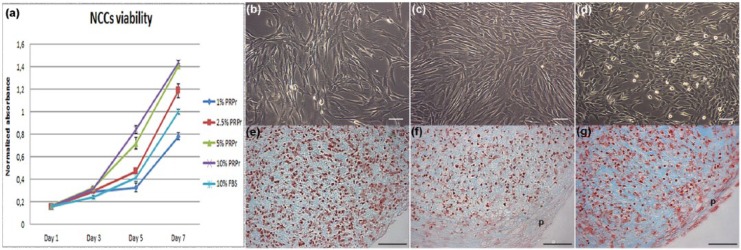
Direct use of PRPr on NCCs expansion and chondrogenic differentiation. (a) NCCs viability curves in the presence of PRPr samples in different concentrations compared to 10% FBS. All values regard to absorbance normalized to 10% FBS neutral red assay absorbance on day 7. The data are presented as a mean and the error bars correspond to standard deviation (SD); (b) 10% FBS–, (c) 2.5% PRPr–, and (d) 10% PRPr–treated cells in monolayer culture in passage 2. Pellets of cells in passage 3 in the presence of (e) 10% FBS, (f) 2.5% PRPr, and (g) 10% PRPr for 21 days. Sulfated GAGs evidenced by alcian blue pH1.0 staining (blue) and cells nuclei by neutral red (red). Outer layer of fibroblastic cells, which regards a perichondrium layer (p). Scale bars: 50 µm.
PRPr: platelet-rich plasma releasate; NCCs: nasoseptal chondrogenic cells; FBS: fetal bovine serum; GAGs: glycosaminoglycans.
