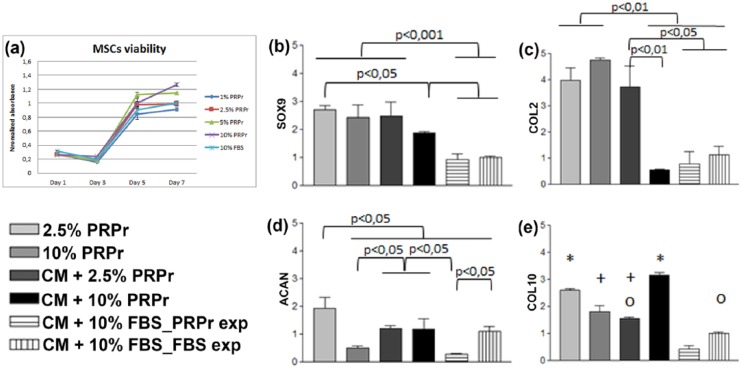
Figure 5.
PRPr effects on MSC expansion and gene expression. (a) MSC viability curves in the presence of PRPr samples in different concentrations compared to 10% FBS. All values regard to absorbance normalized to 10% FBS neutral red assay absorbance on day 7. The data are presented as a mean and the error bars correspond to standard deviation (SD). MSCs were cultured on CHyA scaffolds supplemented with 2.5% PRPr, 10% PRPr, chondrogenic medium with 2.5% PRPr (CM + 2.5% PRPr), chondrogenic medium with 10% PRPr (CM + 10% PRPr), chondrogenic medium with 10% FBS in cells expanded in 2.5% PRPr (CM + 10% FBS_PRPr exp), and chondrogenic medium with 10% FBS in cells expanded in 10% FBS (CM + 10% FBS_FBS exp), which was considered the control condition, and by which the delta Ct results were normalized. (b) SOX9, (c) COL2A1, (d) ACAN, and (e) COL10A1 were analyzed. The results were normalized to the control condition and expressed as relative expression. For (e), similar symbols between groups represent statistic similarity among them (p > 0.05). The data are presented as a mean, and the error bars correspond to SD.
PRPr: platelet-rich plasma releasate; MSC: mesenchymal stromal cell; FBS: fetal bovine serum; CHyA: collagen-hyaluronic acid; CM: chondrogenic medium.

