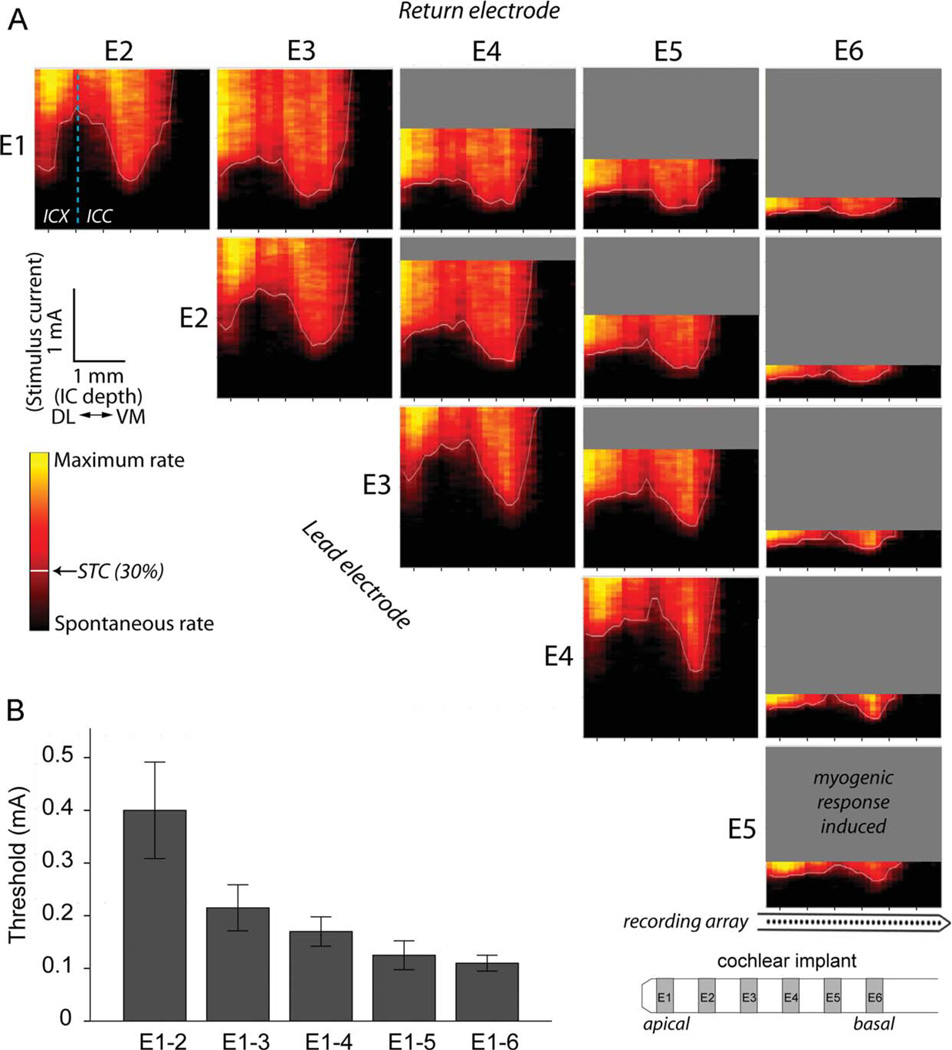
Figure 5.
A: Representative spatial response images across the cochleotopic axis of the inferior colliculus (IC) for each bipolar stimulating electrode from an unstimulated/neurotrophin-treated animal (US/NT). As the site of stimulation is moved from an apical (E1) to a more basal (E6) stimulation site in the lower basal turn of the cochlea, the minima of spatial tuning curves (STC; white lines) recorded within the central nucleus of the inferior colliculus (ICC) occurred at more ventromedial (VM) locations (to the right in each panel). As the interelectrode distance increased, the IC response threshold decreased, and the myogenic threshold also decreased (gray areas). Responses were usually recorded within the external nucleus (ICX) as well, as seen at the dorsolateral (left) recording locations in this example. The dashed line in the E1–2 response panel indicates the physiological boundary between the ICC and ICX. Response intensities have been smoothed and normalized between spontaneous (black) and maximum rate (yellow). Note that the stimulus amplitude (y-axis) is scaled linearly from 0 to 2 mA in this figure due to the large range of thresholds across stimulating electrode configurations. B: Mean ICC thresholds decreased with increasing electrode separation (representative data from the US/NT cohort). Error bars ± 1 SEM.

