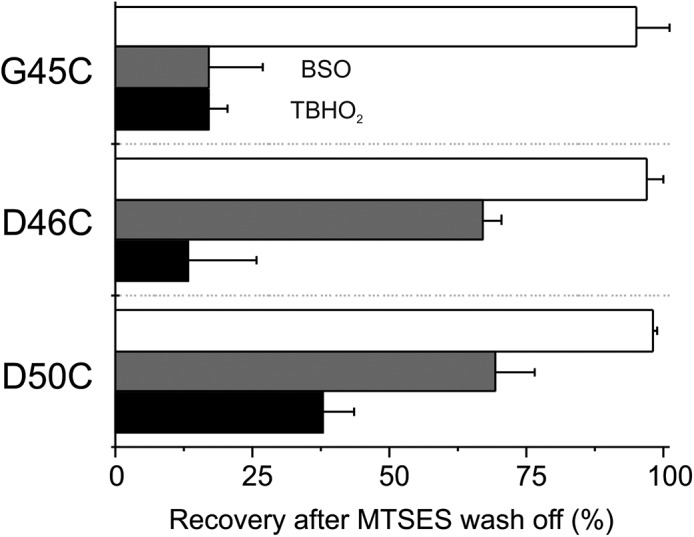
Figure 4.

BSO or TBHO2 treatment significantly decreases recovery after MTSES modification. Percentage of recovery from MTSES modification after BSO (gray bars) or TBHO2 (black bars) treatment in oocytes expressing D50C, D46C, or G45C. White bars correspond to recovery from MTSES modification without any treatment. The values were normalized at steady state or after 300 s of MTSES wash off. Error bars represent the mean ± SEM of at least eight independent measurements.
