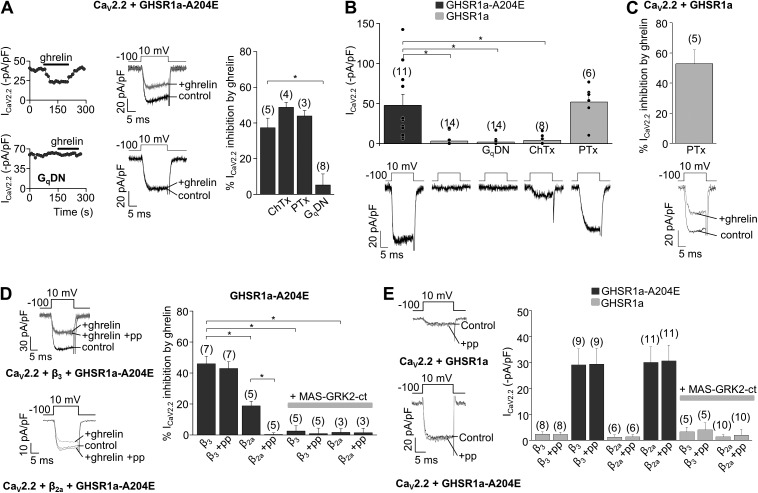
Figure 3.
CaV2.2 inhibition by constitutive and ghrelin-dependent GHSR1a activity is signaled by Gi/o and Gq proteins, respectively. (A) Time course, representative traces, and averaged ICa inhibition by 500 nM ghrelin in HEK 293T cells transfected with CaV2.2, CaVα2δ1, CaVβ3, and GHSR1a-A204E in control conditions or preincubated with 500 ng/ml ChTx or 500 ng/ml PTx, or cotransfected with a GqDN. (B) Representative traces and averaged ICa in HEK 293T cells expressing CaV2.2, CaVα2δ1, CaVβ3, and GHSR1a or GHSR1a-A204E in control or preincubated with 500 ng/ml ChTx or 500 ng/ml PTx, or cotransfected with GqDN. (C) Representative traces and averaged ICa inhibition by 500 nM ghrelin in HEK 293T cells transfected with CaV2.2, CaVα2δ1, CaVβ3, and GHSR1a preincubated with 500 ng/ml PTx. (D) Representative ICa in HEK 293T cells cotransfected with CaV2.2, CaVα2δ1, GHSR1a-A204E, and CaVβ3 or CaVβ2a without (control) or with (+ghrelin) 500 nM ghrelin without or with (+pp) an 80-mV prepulse application (left), and averaged percentage of ICa inhibition by 500 nM ghrelin in cells expressing CaV2.2, CaVα2δ1, and GHSR1a-A204E with the coexpression of CaVβ3 or CaVβ2a and MAS-GRK2-ct and prepulse application (+pp; right). (E) Representative ICa traces from cells cotransfected with CaV2.2, CaVα2δ1, CaVβ3, and GHSR1a or GHSR1a-A204E with (+pp) or without (Control) the application of an 80-mV prepulse (left) and averaged ICa from HEK 293T cells expressing CaV2.2, CaVα2δ1, GHSR1a, or GHSR1a-A204E, with the coexpression of CaVβ3 or CaVβ2a and MAS-GRK2ct and an 80-mV prepulse application (+pp; right). ANOVA with Dunnett’s (A and B) or Tukey’s post-test (D), and two-sample Student’s t test (E). *, P < 0.05. Error bars represent mean ± SE.

