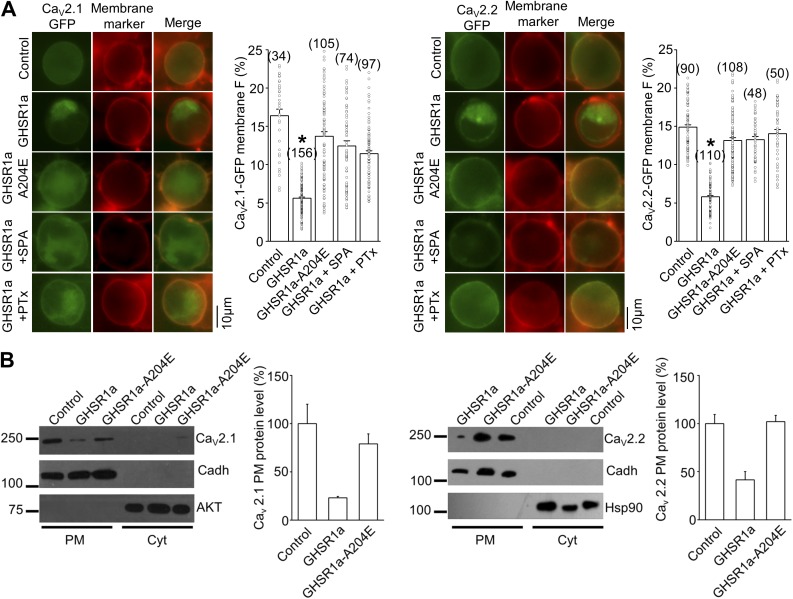
Figure 4.
GHSR1a decreases surface CaV2.1 and CaV2.2 density. (A) Photomicrographs and averaged percentages of green fluorescent plasma membrane signal of HEK 293T cells transfected with CaV2.1-GFP (left) and CaV2.2-GFP (right), its auxiliary subunits (Control) with GHSR1a or GHSR1a-A204E, and preincubated or not with 1 µM SPA or 500 ng/ml PTx. Green and red signals correspond to the eGFP tag on CaV2 and the membrane marker CellMask, respectively. Kruskal–Wallis with Dunn’s post-test; *, P < 0.01. (B) Western blot analysis displaying the CaV2.1-GFP and CaV2.2-GFP protein level in the plasma membrane (PM) or the cytoplasmic (Cyt) fraction of HEK 293T cells transfected with CaV2.1-GFP or CaV2.2-GFP and its auxiliary subunits (Control), and cotransfected with GHSR1a or GHSR1a-A204E (left), and averaged percentage of CaV2.1-GFP and CaV2.2-GFP PM protein level in each condition normalized against cadherin signal used as the plasma membrane loading control (right). Both AKT and Hsp90 as cytosolic markers. n = 2 and 3 for CaV2.1-GFP or CaV2.2-GFP, respectively. Error bars represent mean ± SE.

