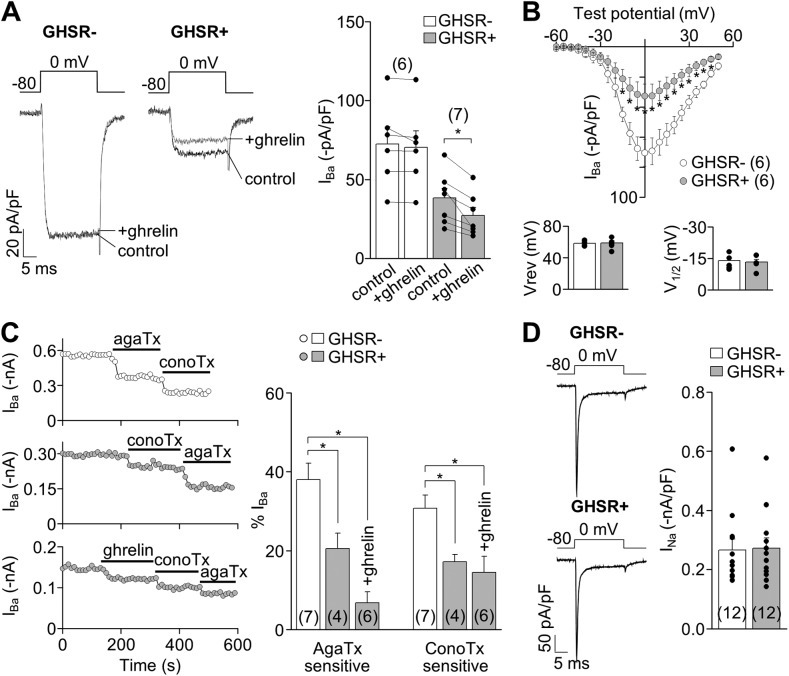
Figure 5.
GHSR1a activity modulates native CaV2 currents in hypothalamic neurons from GHSR-eGFP reporter mice. (A) Representative IBa traces and averaged IBa before (control) and after (+ghrelin) 500-nM ghrelin application in hypothalamic GHSR1a− and GHSR1a+ neurons. (B) Averaged peak IBa–voltage (I-V) relationships (evoked from a holding of −80 mV), reversal (Vrev), and activation (V1/2) potential midpoints (calculated by Boltzmann linear function) obtained from GHSR1a− and GHSR1a+ neurons. (C) IBa time courses of application of 1 µM ω-conotoxin-GVIA (conoTx) and 0.2 µM ω-agatoxin-IVA (agaTx) with or without previous 500-nM ghrelin application from hypothalamic GHSR1a− (top) and GHSR1a+ neurons (middle and bottom; left). Averaged percentage of IBa sensitive to agaTx and conoTx from GHSR1a− and GHSR1a+ neurons, with (+ghrelin) or without 500-nM ghrelin application (right). (D) Representative and averaged INa from GHSR1a− and GHSR1a+ neurons. Paired (A) or two-sample (B and D) Student’s t test and ANOVA with Dunnett’s post-test (C). *, P < 0.05. Error bars represent mean ± SE.

