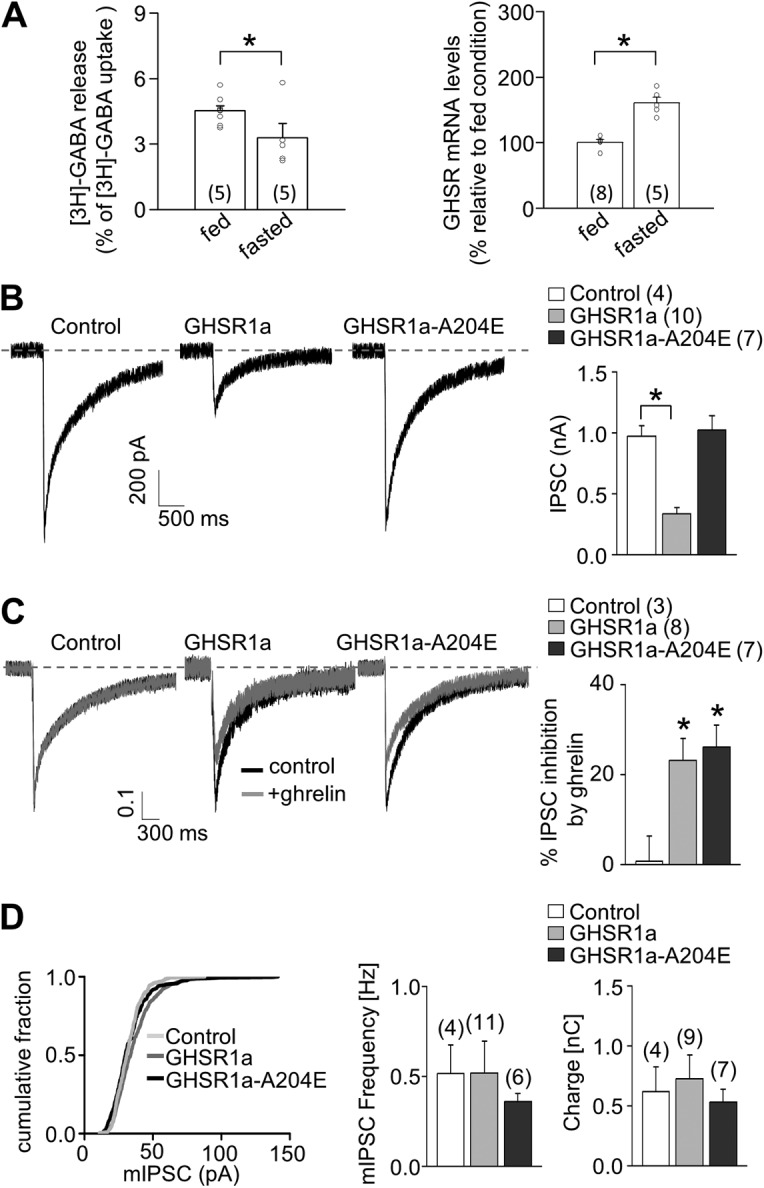
Figure 7.

GHSR1a activity impacts GABA release. (A) [3H]GABA release (left) and GHSR1a mRNA levels (right) from ARC-enriched explants from ad libitum–fed or 48 h–fasted mice. (B) Representative traces and averaged IPSC size obtained from GHSR-null primary cultured neurons transduced or not with GHSR1a-YFP and GHSR1a-A204E-YFP. (C) Representative normalized traces with or without the application of 500 nM ghrelin, and average values of percentage of IPSC inhibition by ghrelin obtained from GHSR-null primary cultured neurons transduced or not with GHSR1a-YFP and GHSR1a-A204E-YFP. (D) Distribution of mIPSC size and averaged values for mIPSC frequencies and charge movement by 0.5-M sucrose solution application in GHSR-null primary cultured neurons transduced or not with GHSR1a-YFP and GHSR1a-A204E-YFP. Two-sample Student’s t test (A) and ANOVA with Dunnett’s post-test (B–D). *, P < 0.05. Error bars represent mean ± SE.
