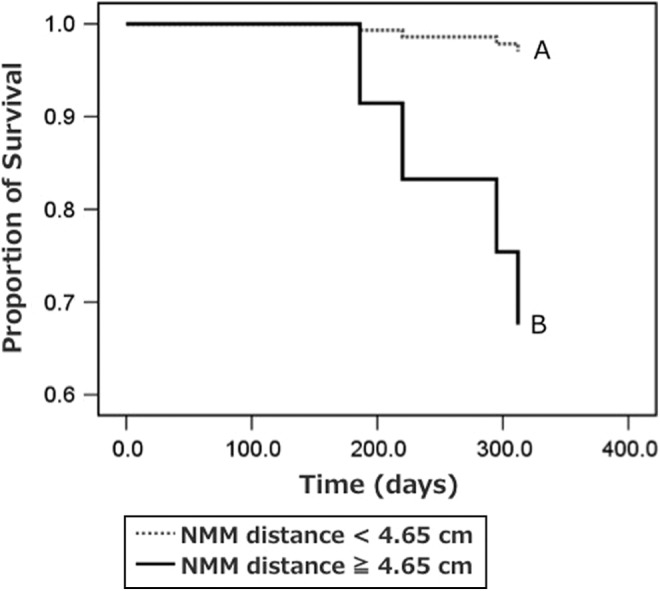
Figure 3.

Survival curves for athletes sorted by navicular–medial malleolus (NMM) distance based on the Cox regression model. The gray dotted line represents athletes with NMM distance <4.65 cm (group 1); the black line represents athletes with NMM distance ≥4.65 cm (group 2).
