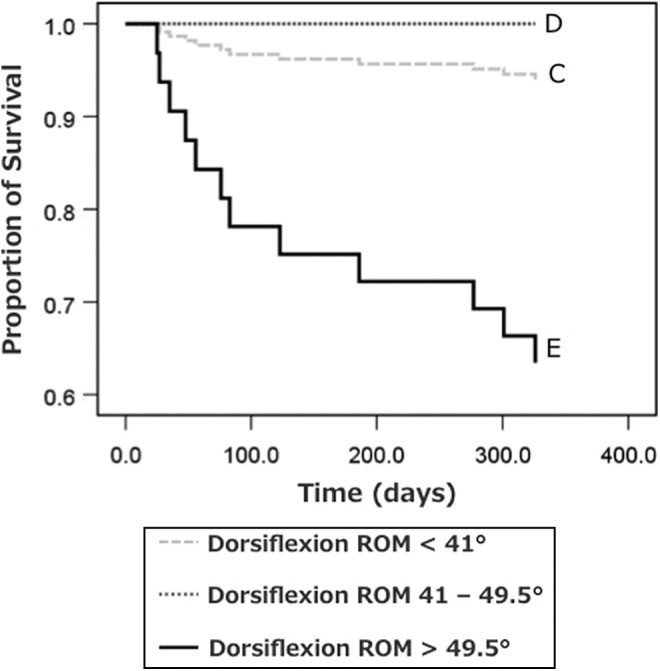
Figure 5.

Survival curves for athletes sorted by weightbearing dorsiflexion range of motion (ROM) based on the Cox regression model. The light gray dotted line represents athletes with dorsiflexion ROM <41° (group 1), the dark gray dotted line represents athletes with dorsiflexion ROM 41° to 49.5° (group 1), and the black line represents athletes with dorsiflexion ROM >49.5° (group 3).
