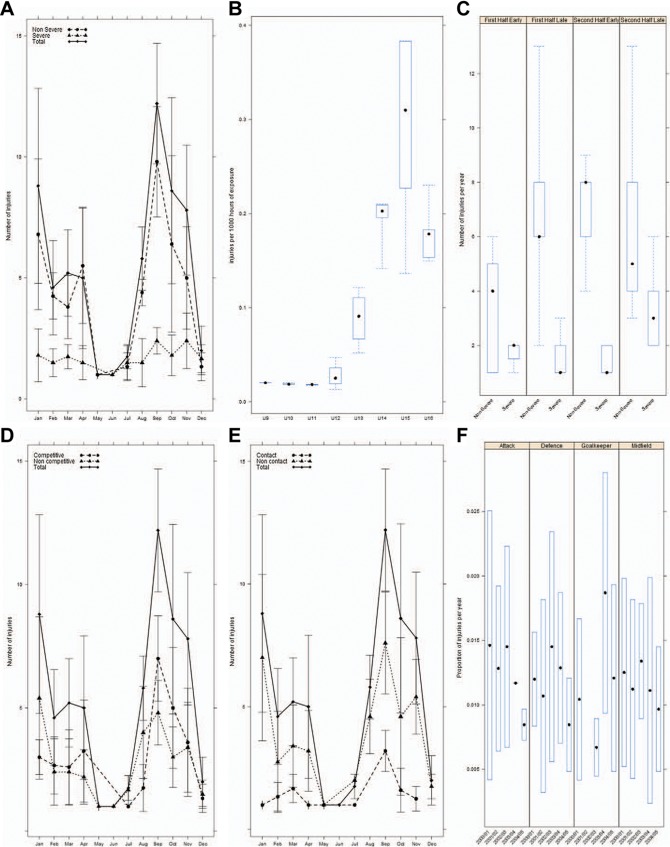
Figure 2.
Descriptive statistics of the data. (A) Average monthly incidence of injury by severity. (B) Annualized injury incidence/1000 hours of exposure for age groups <9 to <16 years. (C) Number of injuries/year for the 4 periods during the match. (D) Average monthly incidence of injury by competitive environment. (E) Average monthly incidence of injury by mechanism. (F) Number of injuries/year by position played. Box-and-whisker plots in B, C, and F: the dot indicates the median and the box indicates the interquartile range (IQR).

