
Figure 2.
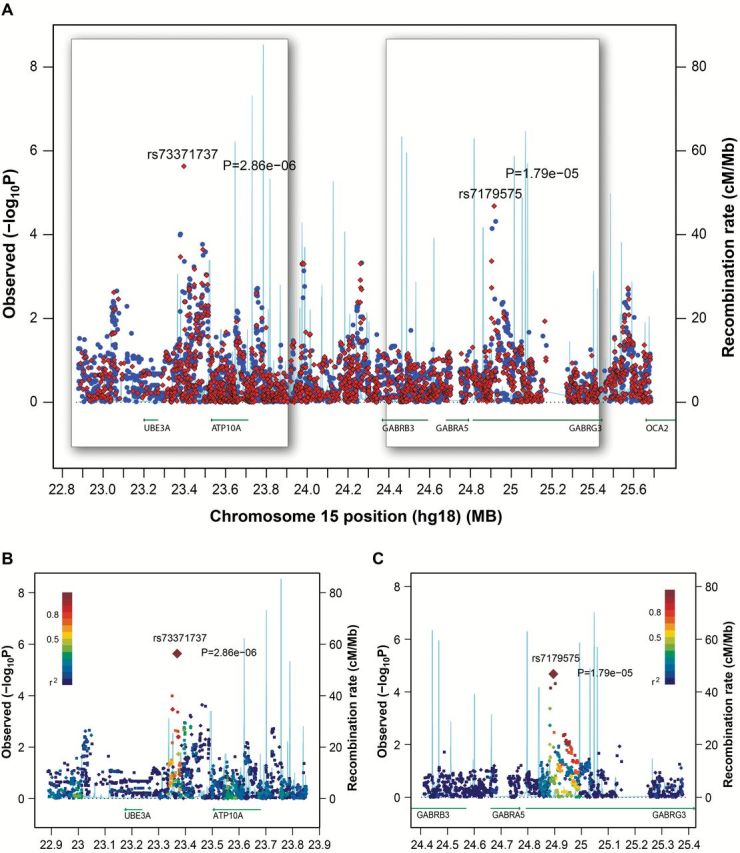
Imputation of chromosome 15q12. Imputation was conducted using phased genotype data of European (EUR) populations from the 1000 Genomes project. A) Genetic associations are plotted for 6557 variants (MAF ≥ 0.05) within the region of Chr15: 22.8 – 25.7Mb (NCBI build 36) that include 4810 imputed variants (dosage R2 is ≥ 0.3). Red diamonds are genotyped variants. Blue dots are imputed variants. The two 3D areas are detailed in panels (B) and (C) for rs73371737 and rs7179575. Diamonds are genotyped variants. Squares are imputed variants. Degree of linkage disequilibrium (LD) is schemed as the gradient of purple to blue color, with purple as perfect LD (R2 = 1) and blue as no LD (R2 = 0). Statistical tests were two-sided.