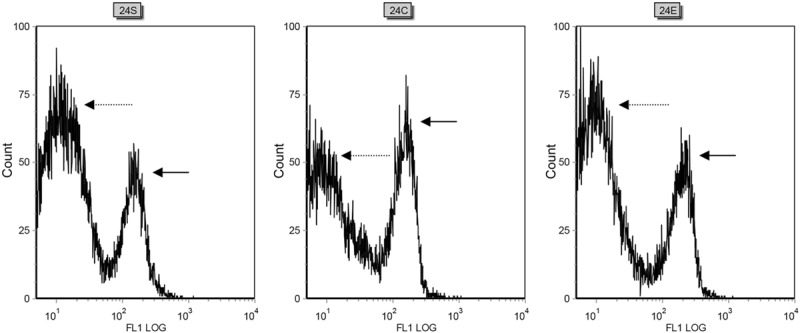
Figure 4.

Representative flow cytometry traces to show measurement of mitochondrial membrane potential in the three experimental groups (sham, CLP and CLP+EP). 24S: Measurements made 24 hours after surgery in the sham group show a peak in the 101 region (broken arrow), representing cells without mitochondrial depolarization, and a second peak in the 102-103 region (solid arrow), indicating mitochondrial depolarization. 24C: 24 hours after surgery, the CLP group showed a higher peak in the 102-103 region (solid arrow) and a lower peak in the 101 region (broken arrow), compared with the sham group, reflecting an increase in mitochondrial depolarization. 24E: The CLP+EP group showed a reduced peak in the 102-103 region (solid arrow) and a corresponding enhanced peak in the 101 region (broken arrow), compared with the CLP group, such that the trace resembled that for the sham group. This is consistent with EP reducing mitochondrial injury and depolarization following CLP-induced sepsis.
