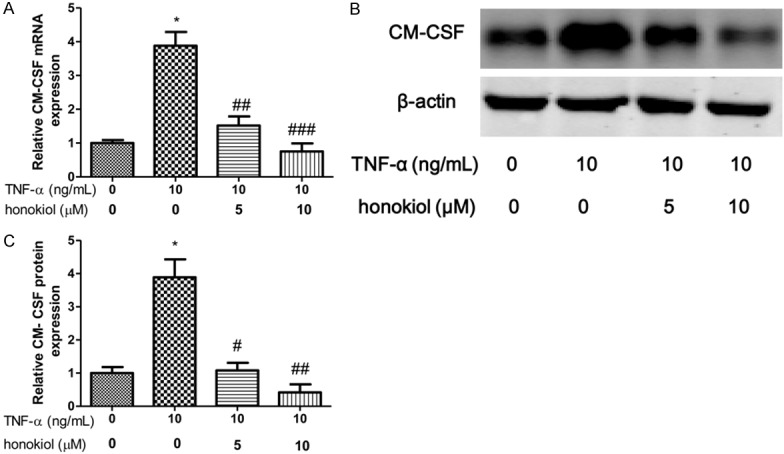
Figure 5.

Honokiol inhibited TNF-α-induced GM-CSF production. mRNA (A) and protein (B) expression were measured by real-time PCR and western blotting respectively. Densitometric quantification for western blotting (C). Values are expressed as mean ± SD, n = 4 in each group. *P < 0.05 versus control group; #P < 0.05, ##P < 0.01, ###P < 0.001 versus TNF-α-treated group.
