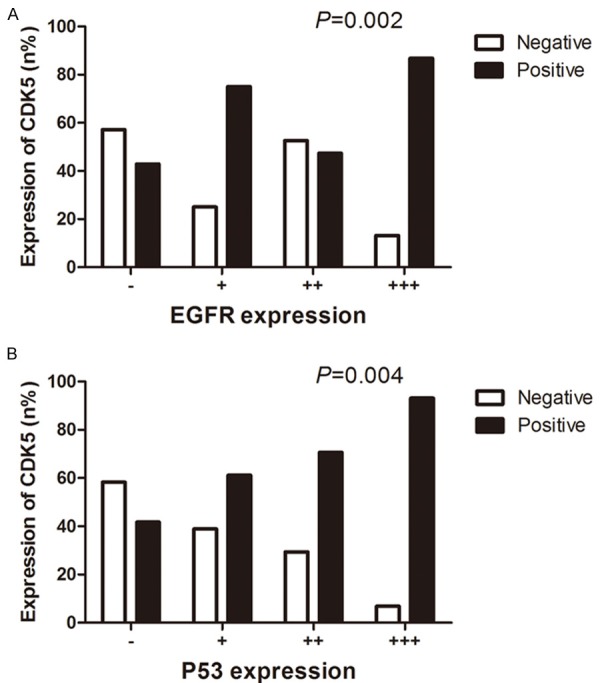
Figure 4.

The relationships between CDK5 expression and other biochemical indicators. Patients expressing high levels of EGFR presented significantly higher positive rates of CDK5 than those with low expression levels of EGFR (P=0.002) (A). It was obvious that the CDK5-positive rate was consistent with the inclination of P53 and experienced an upturn in relatively high-level group of P53 (P=0.004) (B).
